Your First chat
To begin your first analysis, please prepare the data you'd like to explore. You can try:
- Upload your data files
Click to upload or simply drag & drop your spreadsheet(CSV/Excel).
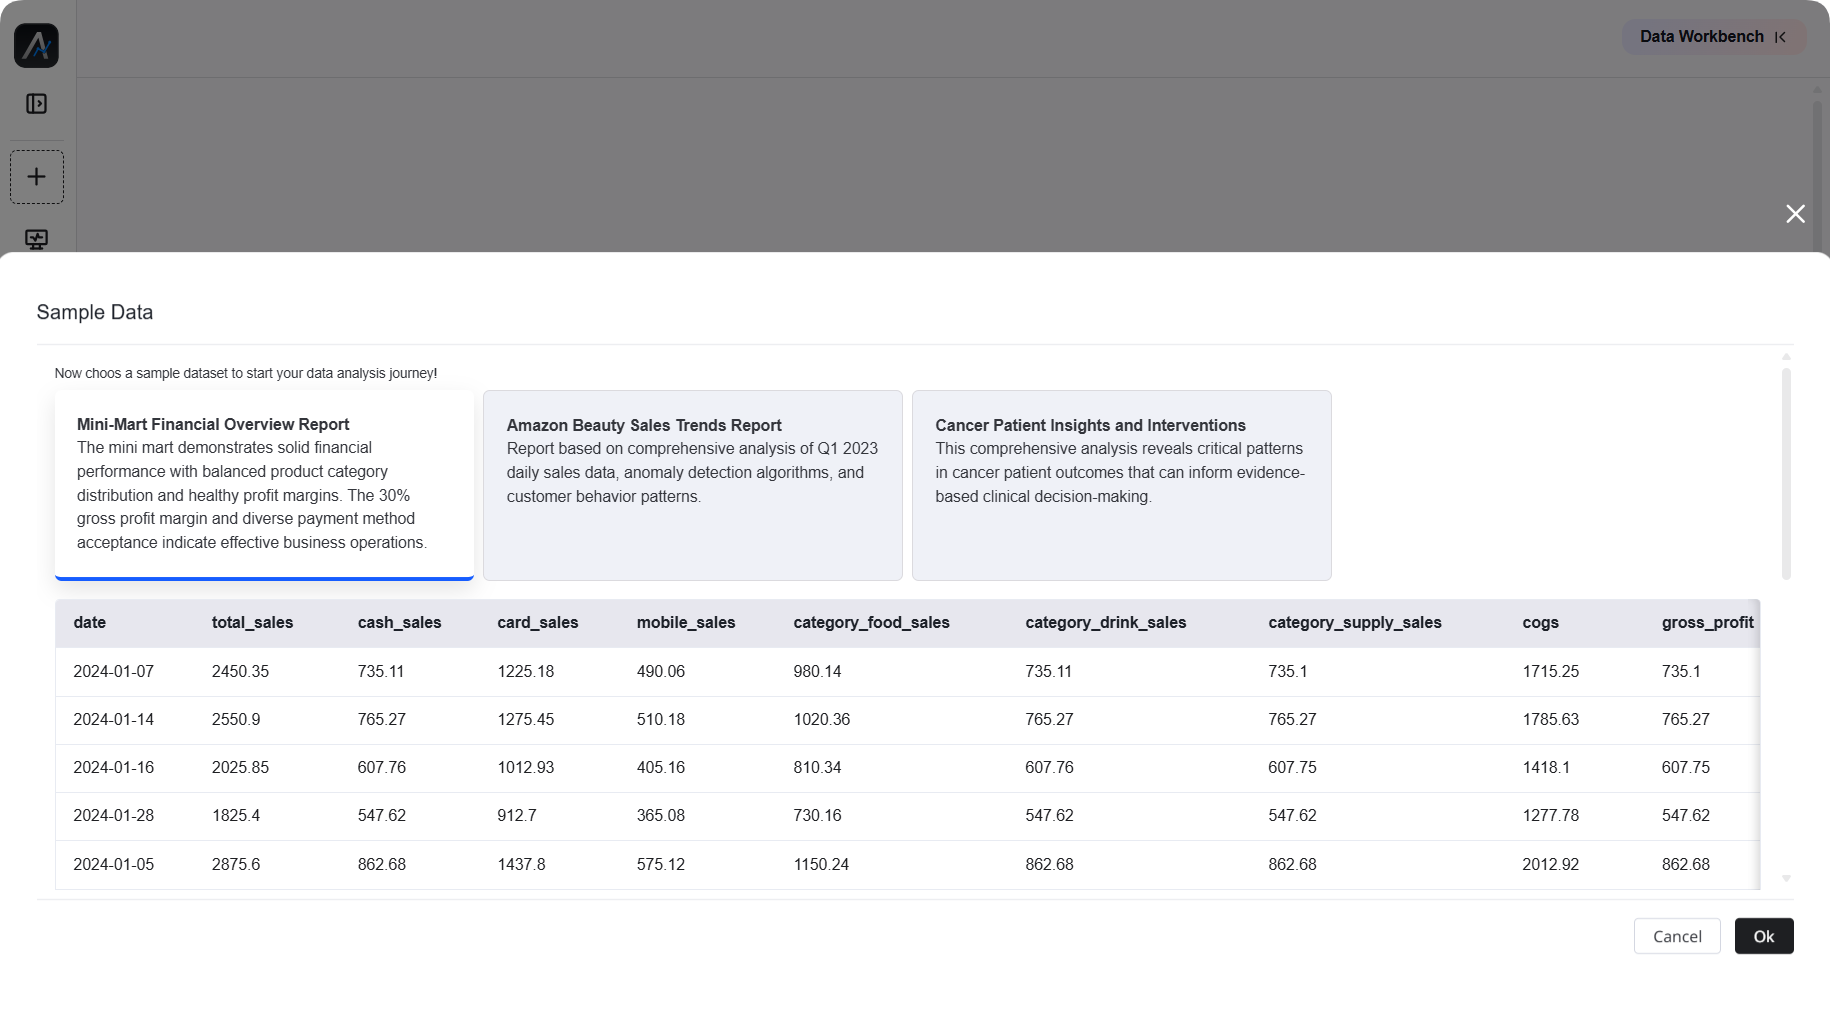
- Try example datasets
Want to explore first? Use our pre-loaded example datasets to drive the analysis.
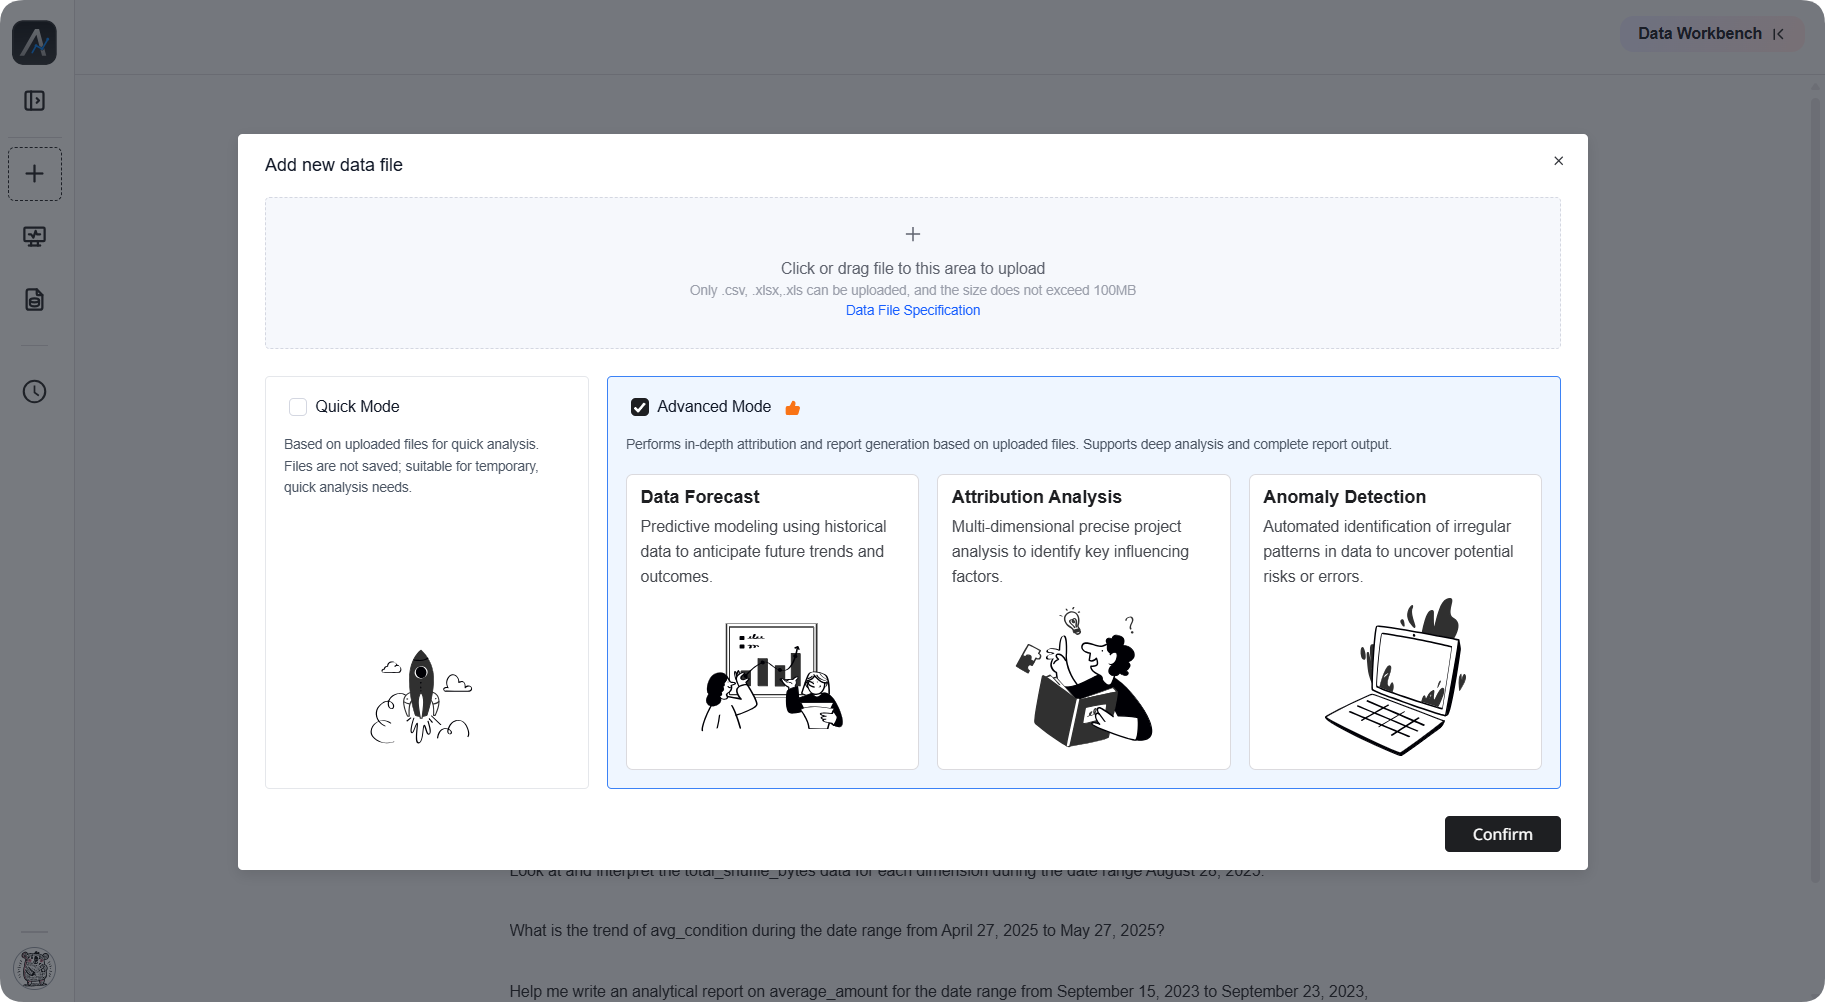
After selecting your data,choose how you'd like to analyze: quick insights or deeper exploration?
- Quick Mode
This mode delivers immediate analysis results without processing delays, so it's best for simple queries on spreadsheet content such as "Show sales trends". Switch to this mode and start asking questions – your data will answer!
- Advance Mode
This mode supports advanced analysis like attribution analysis, data forecasting, and in-depth reports. Meanwhile, Ada generates and retains semantics from your data file to power ongoing analysis, which can be managed in Data Workbench. If you want to dive deeper over time, this mode is perfect for sustained analysis.
Now that your data is ready, let's explore it through natural conversation. Take product sales data as an example, and here's how to get the best answers.
- Start Simple - Try Basic Queries
Begin with straightforward questions to see instant insights:
-
Show me total sales by month.
-
What's the average order value?
-
List top 5 products by revenue.
- Go Deeper - Ask Follow-up Questions
The conversation remembers your context. Just build on previous answers:
-
Now compare that to last year.
-
Break it down by region.
-
Show me the distribution of product sales across categories.
- Get Creative - Advanced Analysis (Advanced mode only)
Push further with intelligent requests:
-
Find anomalies in the data.
-
What factors caused this trend.
-
Suggest ways to improve profitability.
Pro Tip: The more specific your question, the better the analysis. Instead of "Tell me about sales", try "Show sales growth by product category in Q2".