User Guide: Data Workbench
1. Overview
The Data Workbench is the central repository for managing the information ChartGen AI uses to answer your questions. It serves as a unified hub where you can access industry-standard public datasets or securely manage your own private data sources.
2. Public Data
"Ready-to-use datasets for immediate insight."
The Public Data tab offers a library of curated, high-quality datasets and pre-configured APIs that you can call directly within ChartGen AI.
Instant Access: Datasets are pre-processed and ready for analysis immediately—no cleaning required. APIs are pre-configured and callable with a single click, delivering live external data straight into your analysis.
Fusion Analysis: This is ideal for benchmarking. You can combine these external standard datasets and API outputs with your internal private data to perform comparative analysis (e.g., comparing your company's Private Sales Data against Public Economic Indicators or live market data from a public API).
3. Private Data
"Your secure data hub."
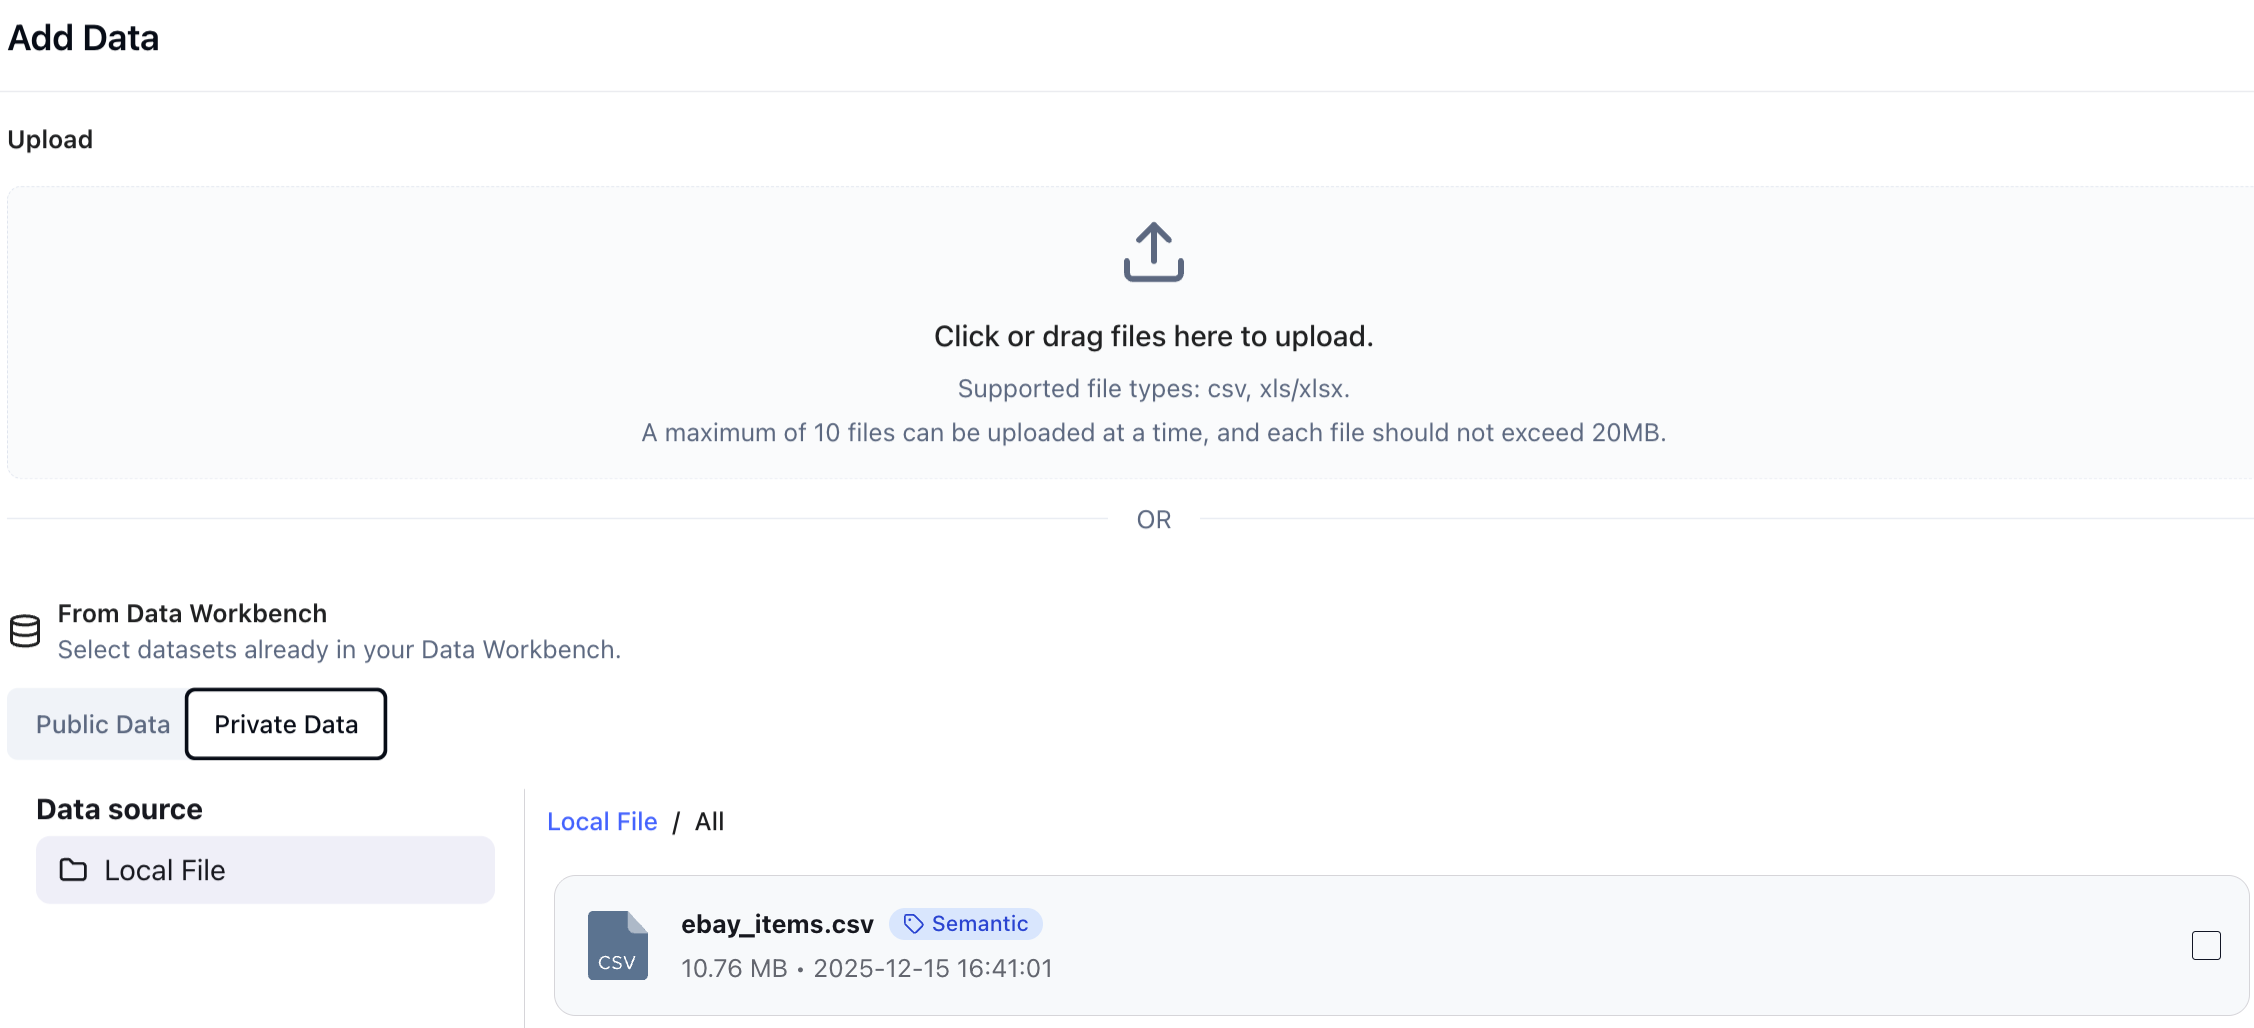 The Private Data tab is where you manage your own organizational data. There are two ways to bring data into ChartGen AI:
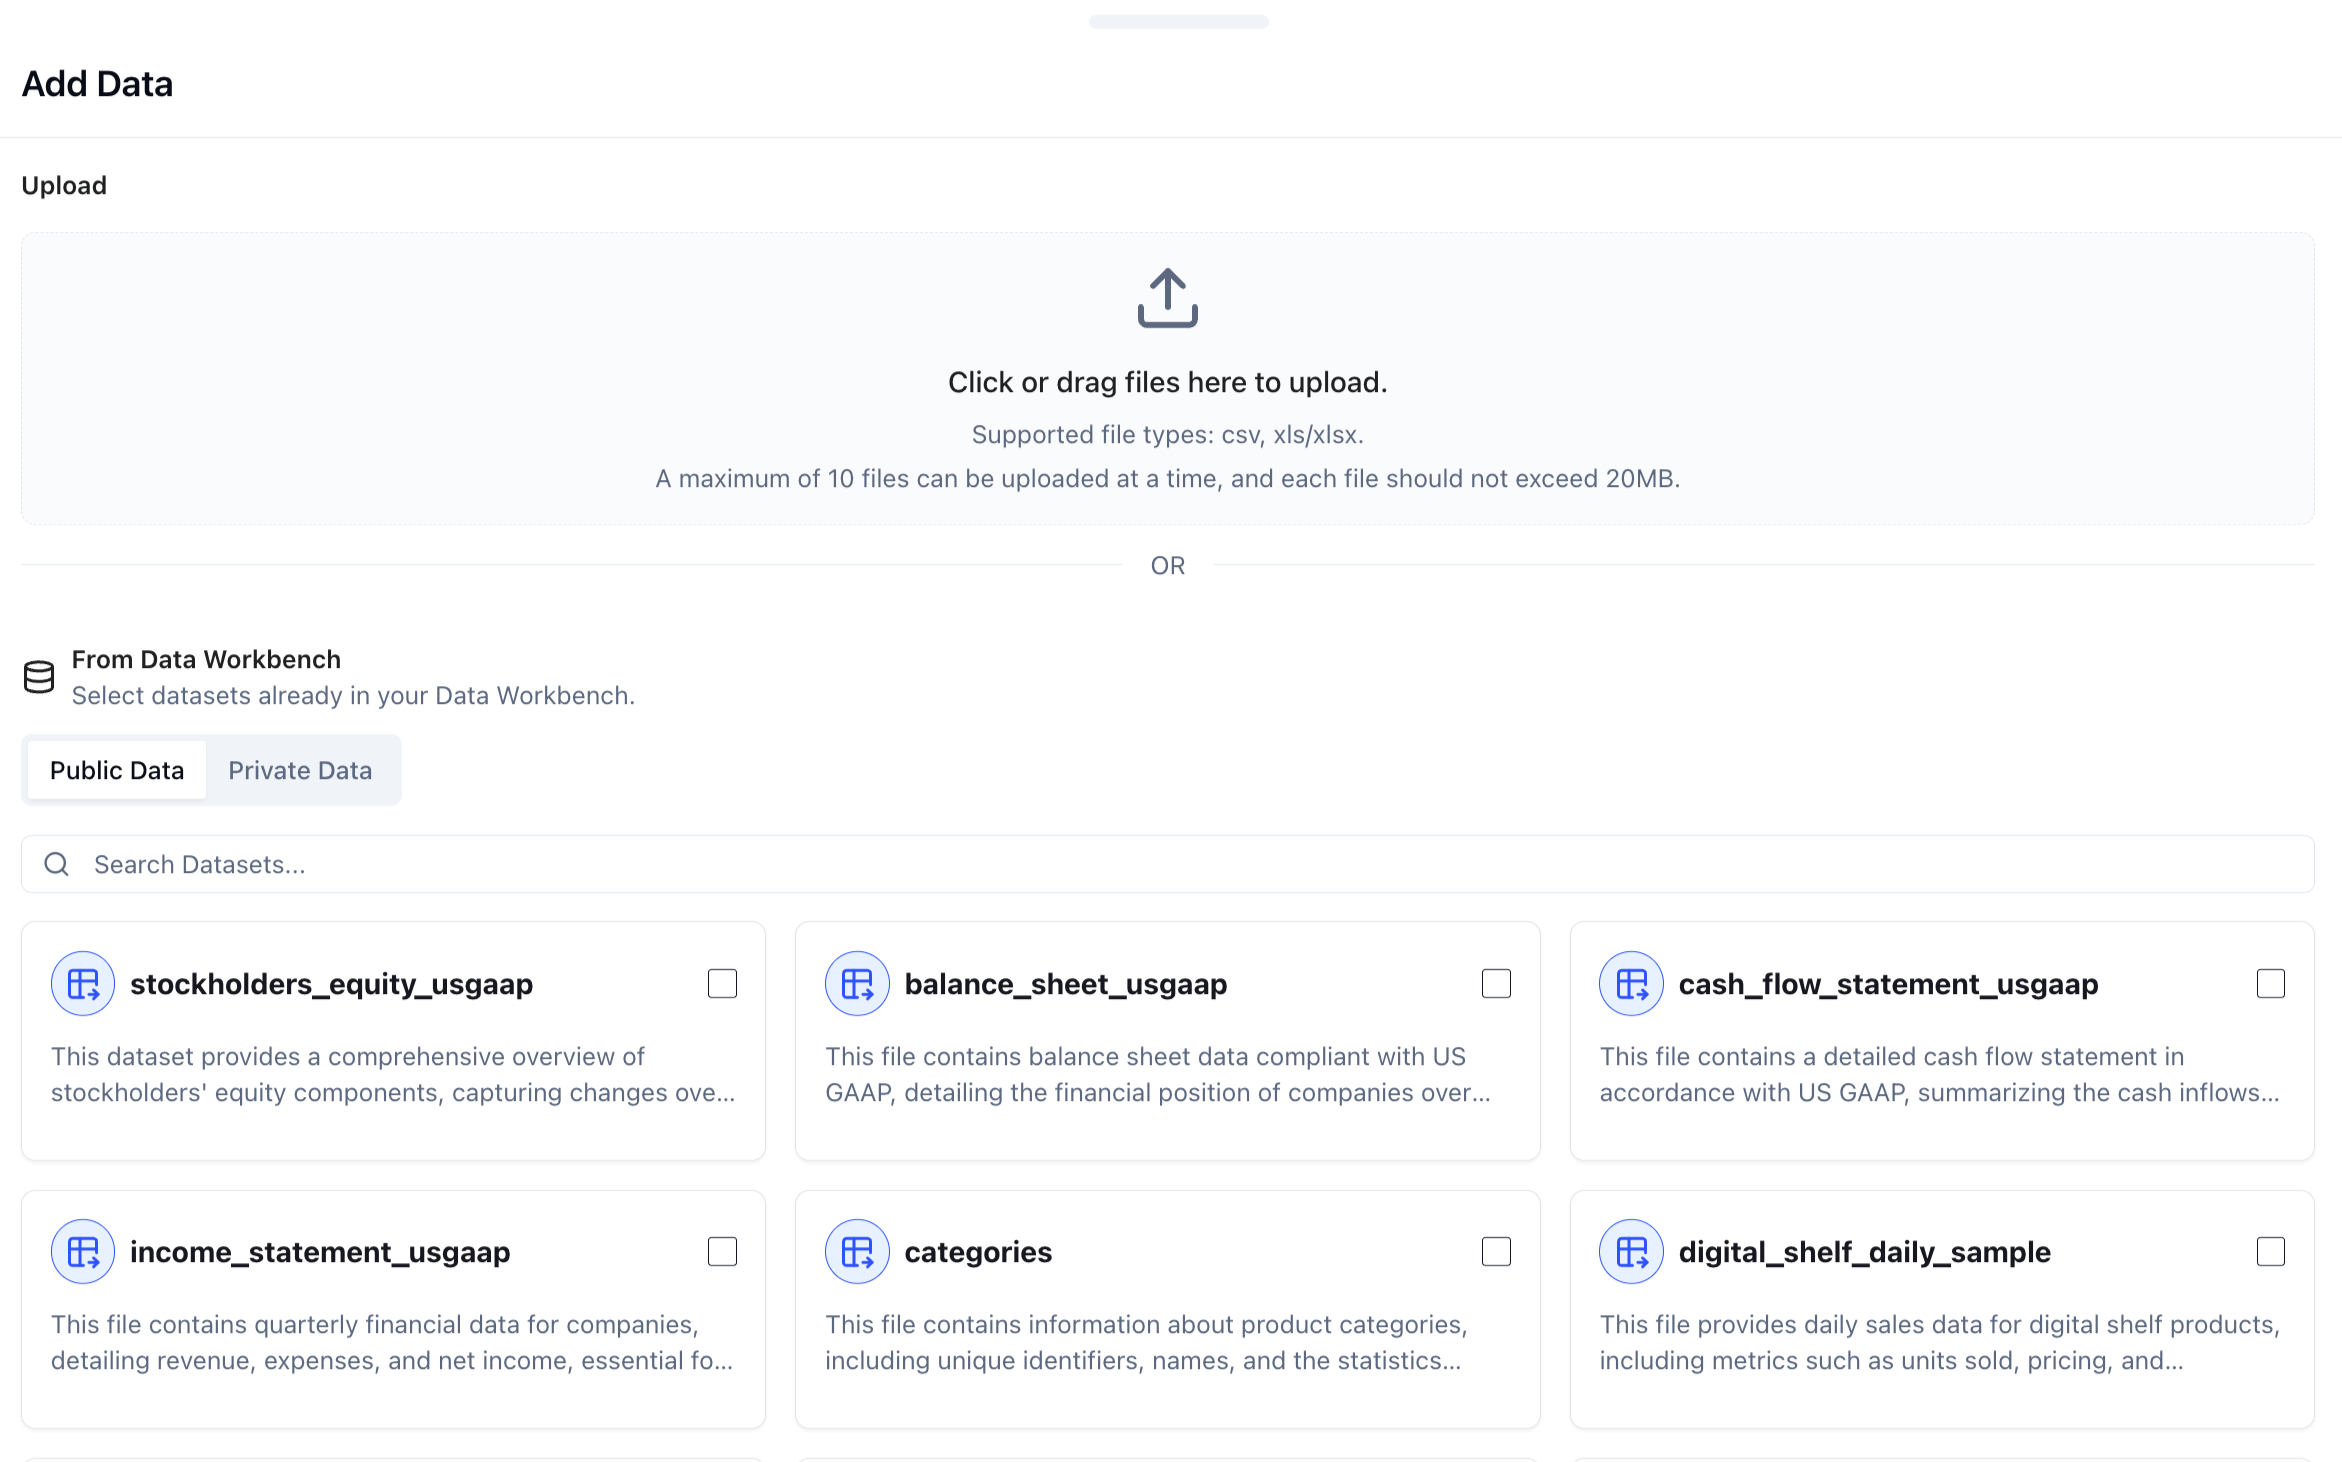
3.1. File Upload (Local Data)
For ad-hoc analysis or static reports:
- Click "+ Add Data" or "Connect Data". The upload entry is available from the Home page, inside any Project, and within the Data Workbench, so you can bring in files wherever you are working.
- Drag and Drop your files into the upload area.
- Supported Formats: ChartGen AI accepts both structured data and unstructured documents, including
.csv,.xls,.xlsx,.pdf,.docx, and.md. - Constraint Note: You can upload up to 10 files at a time (max 100MB per file).
3.2. Data Integrations (Live Connections)
For continuous monitoring, connect directly to your business applications. ChartGen AI supports:
- Finance & Ops: QuickBooks, NetSuite, Stripe, eBay.
- Databases: MySQL, PostgreSQL, SQL Server, Snowflake, Azure SQL.
- And more. Feel free to contact us if you need to connect other data sources.
Once connected, ChartGen AI can pull fresh data automatically, ensuring your reports always reflect the latest numbers.
3.3. File Processing: Data Analysis vs Data Extraction
When you upload a file, ChartGen AI lets you choose how it should be processed. Two methods are available, each suited to a different type of content:
Data Analysis — Directly analyzes the data and content within your file. Efficient for structured data such as Excel, CSV, and database tables, and equally capable of comprehending entire documents — including academic papers, business reports, product documentation, and manuals — to generate insights and artifacts.
Data Extraction — Pulls tables and structured data out of your file first, then conducts analysis based on the extracted results. Particularly suited for complex documents that contain both structured and unstructured information — for example, a PDF report with embedded tables, or a Word document mixing narrative and figures.
4. Smart Semantic
 "Transform raw files into analytical models."
Simply uploading a spreadsheet isn't enough for deep AI reasoning. The Smart Semantic engine is a powerful feature that structures your data for accurate analysis.
How it Works
When you run the "Smart Semantic" tool:
- Transformation: ChartGen AI scans the raw data to identify logical relationships.
- Definition: It automatically extracts and defines:
- Metrics: Quantifiable numbers (e.g., Revenue, Churn Rate).
- Dimensions: Categorical data (e.g., Region, Product Category, Time).
- Tables: How different data sheets relate to each other.
Why Use It?
- High Stability: It reduces AI "hallucinations" by grounding the model in structured definitions.
- Deep Analysis: It enables complex operations like Attribution Analysis (understanding what drives a change in a metric) which is impossible with flat, unstructured text.
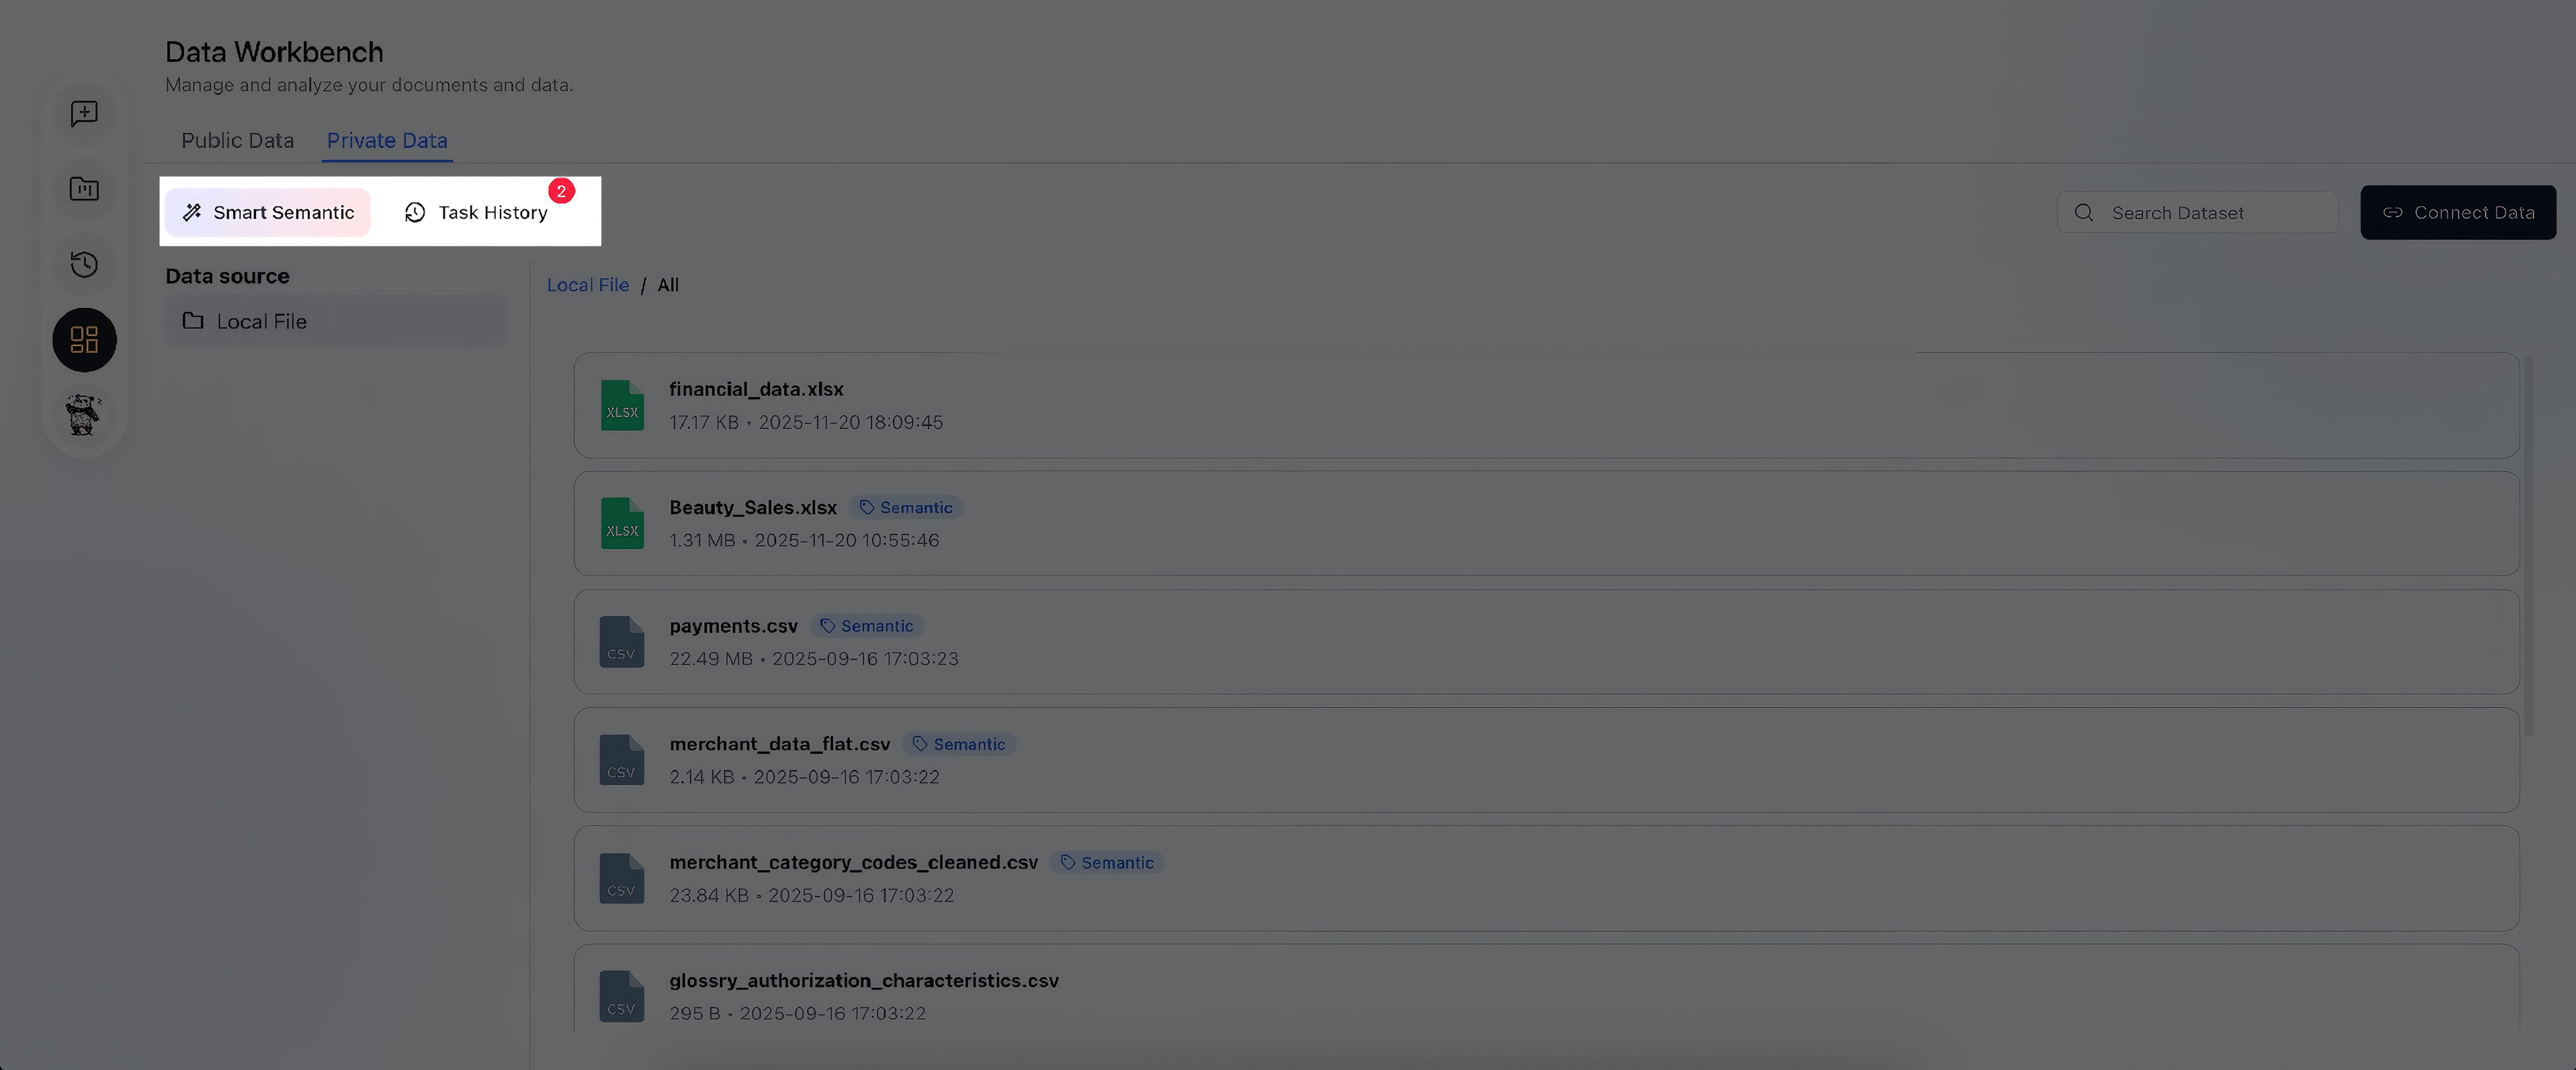
5. Managing Your Workbench
In the Private Data list view, you can track the status of your assets:
- Search: Quickly find datasets by name.
- Status Tags: Look for the "Semantic" tag next to a filename. This indicates the data has been successfully processed by the Smart Semantic engine and is ready for deep analysis.
- Task History: Click this to view the log of semantic processing jobs.