Analytical Capabilities & Features
How to Analyze, Produce, and Manage Insights with ChartGen AI.
How Data Analysis Works in ChartGen AI
Data Query - Foundational Analysis
- Ask in Natural Language
Interact with your data using natural language, eliminating the need for SQL or rigid keywords. ChartGen AI understands complex intent and domain-specific terminology with precision. Furthermore, the system proactively selects the optimal visualization strategy, instantly rendering a summary metric, trend chart, or detailed table to best match your data context.
You can freely describe your needs like this in the dialogue box:
"Show total revenue for the last 30 days"
"Compare Q1 vs. Q2 sales performance by region"
"Analyze the drivers behind the decline in Gross Profit Margin for the Asia Pacific market in 2024, specifically filtering for product categories with high inventory turnover"
ChartGen AI delivers more natural, human-like responses out of the box. Replies are clearer, better structured, and easier to follow — whether you're asking a quick lookup or a deeper analytical question. There's no mode to choose and nothing to configure; just ask, and ChartGen AI responds in a way that feels like talking to a thoughtful analyst.
- Explore data more deeply
With Deep Analysis enabled in the dialogue box, ChartGen AI first validates your intent, then expands the task scope by synthesizing your specific requirements with domain expertise. For open-ended exploration, this feature ensures you receive a comprehensive, thoroughly analyzed solution.
Deep Analysis involves several key components:
1.Multi-step Reasoning: The system processes information through multiple layers of reasoning, allowing it to tackle complex tasks effectively.
2.Autonomous Planning: It autonomously formulates plans based on user requirements, and can dynamically adjust its approach depending on the specific context during execution.
3.Reflection: The system incorporates a reflective mechanism that assesses its reasoning and decisions, ensuring continuous improvement.
4.User Intervention: Users are given opportunities to modify their intent, enhancing the interactivity and accuracy of the analysis process.
Advanced Data analysis
Interpretation
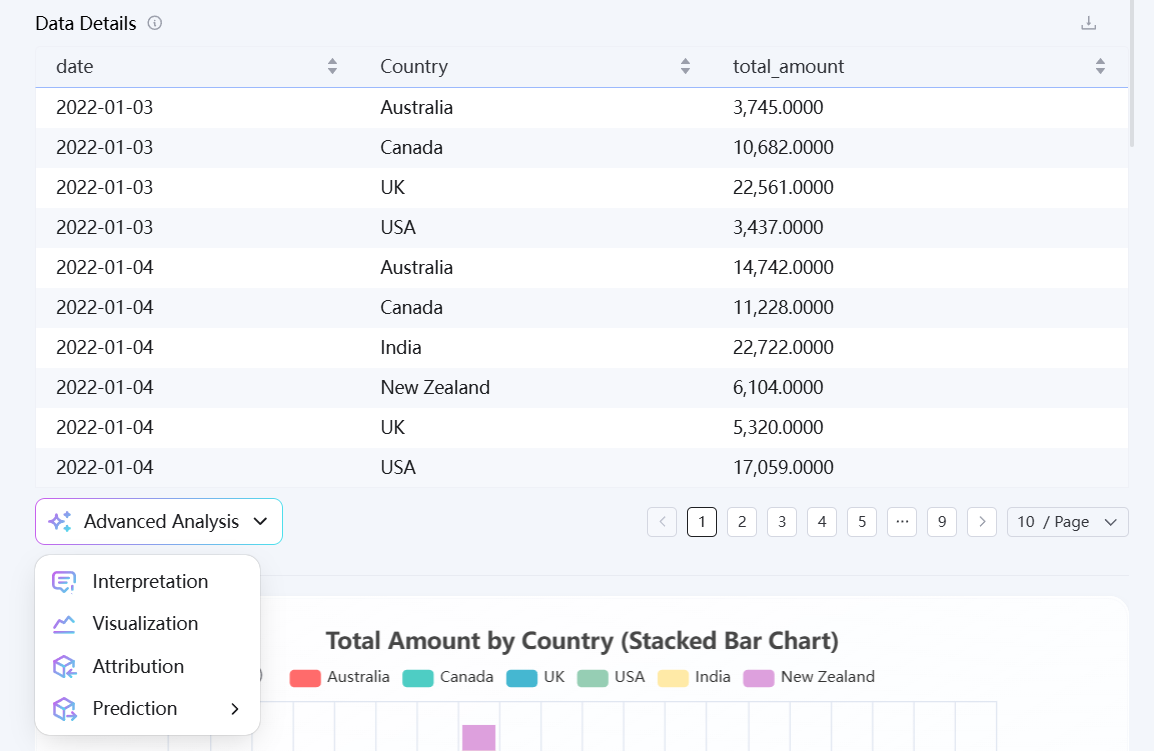
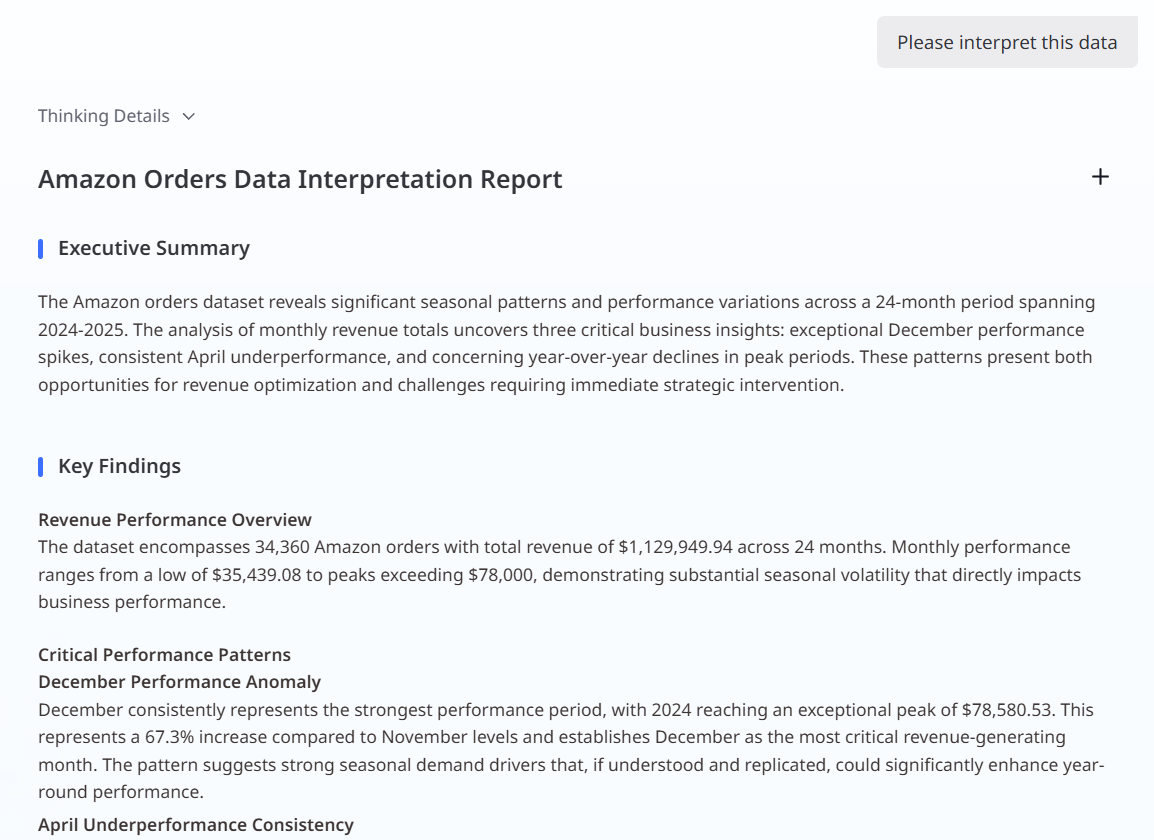
ChartGen AI performs in-depth analysis of complex datasets to identify critical trends, patterns, and anomalies. To generate a structured insight report, simply describe your analysis requirements or click the Interpretation button located below the query results. ChartGen AI will instantly present a comprehensive summary highlighting key issues that demand attention.
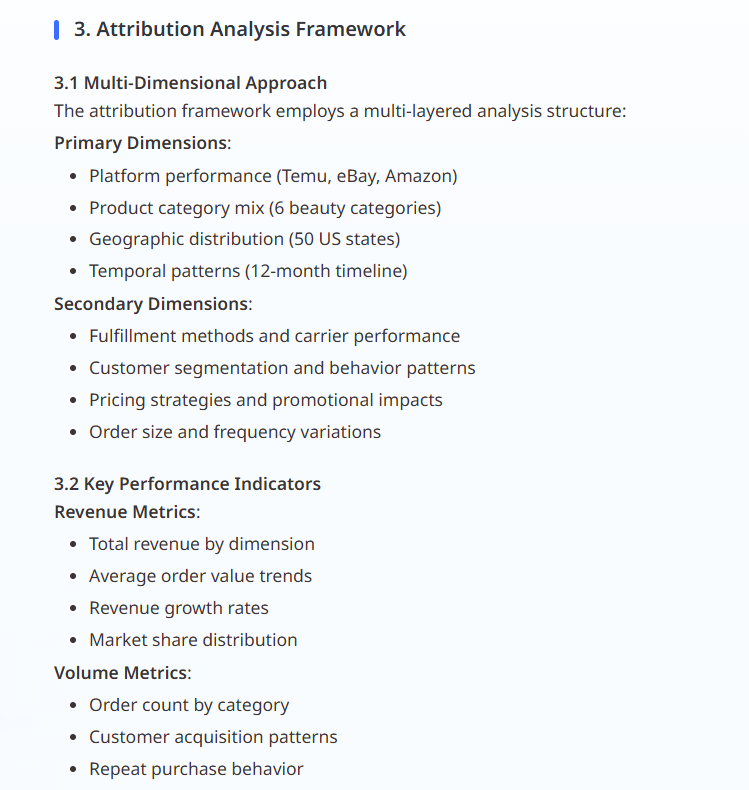
Attribution
You can access Advanced Analysis directly from the charts generated in chat.
Click Advanced Analysis below any chart to explore what’s driving metric changes. ChartGen AI breaks down fluctuations across key components and dimensions, quantifies each factor’s contribution, and highlights the primary drivers behind the variance—for example, identifying which factors contribute most to a GMV change based on its formula structure.
Prediction
Use Time Series Forecasting to explore how your metrics may evolve.
Click the Prediction button at the bottom-left of the chart to extend the time series into the future. ChartGen AI analyzes historical patterns to generate forward-looking projections, helping you anticipate potential changes and plan ahead.
Turning Analysis into Deliverables
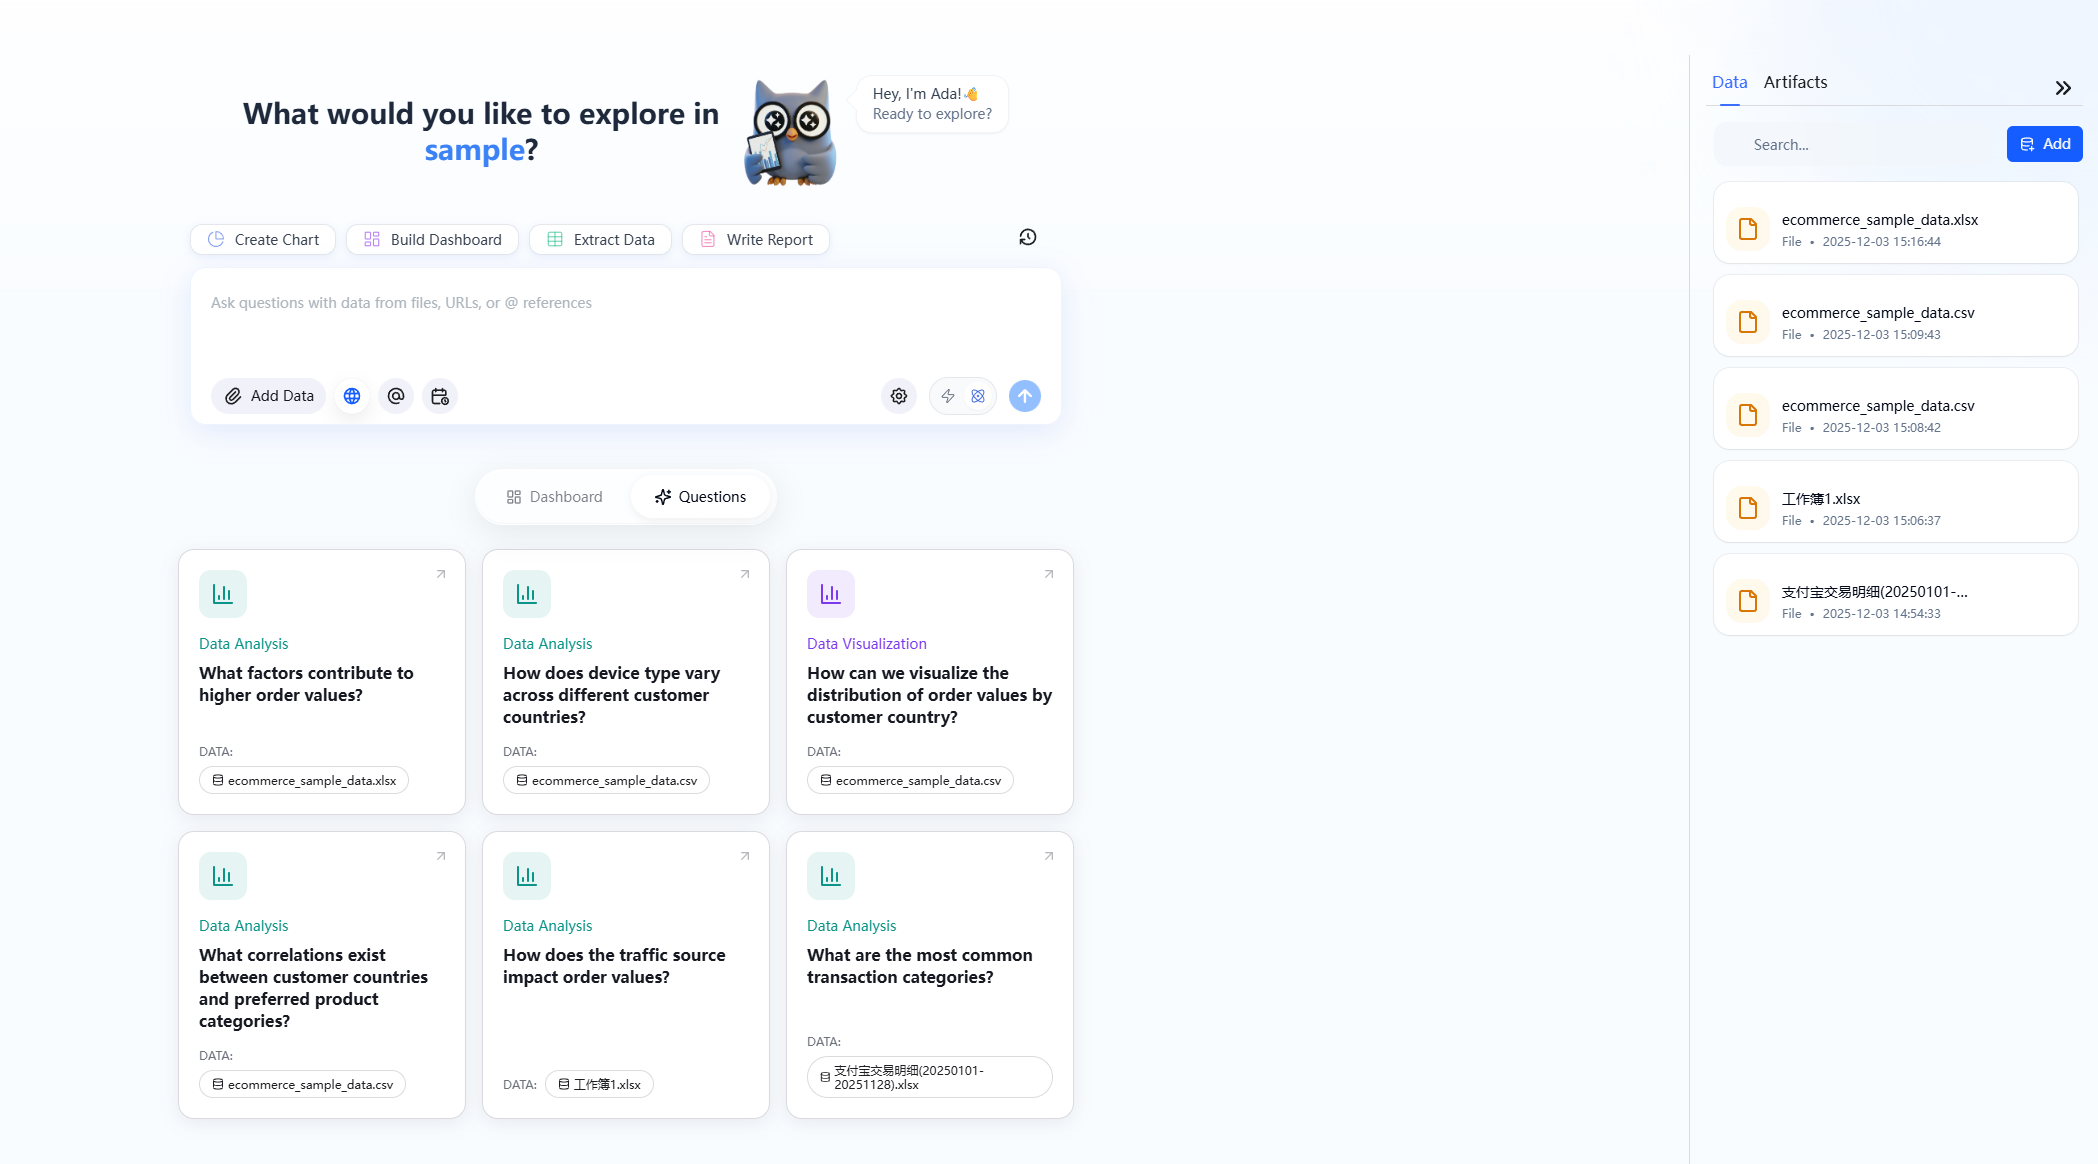
Quick Access
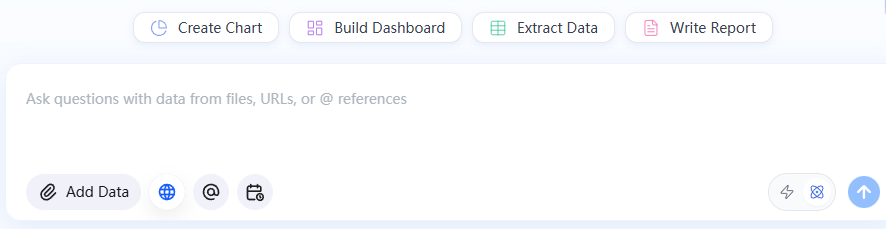
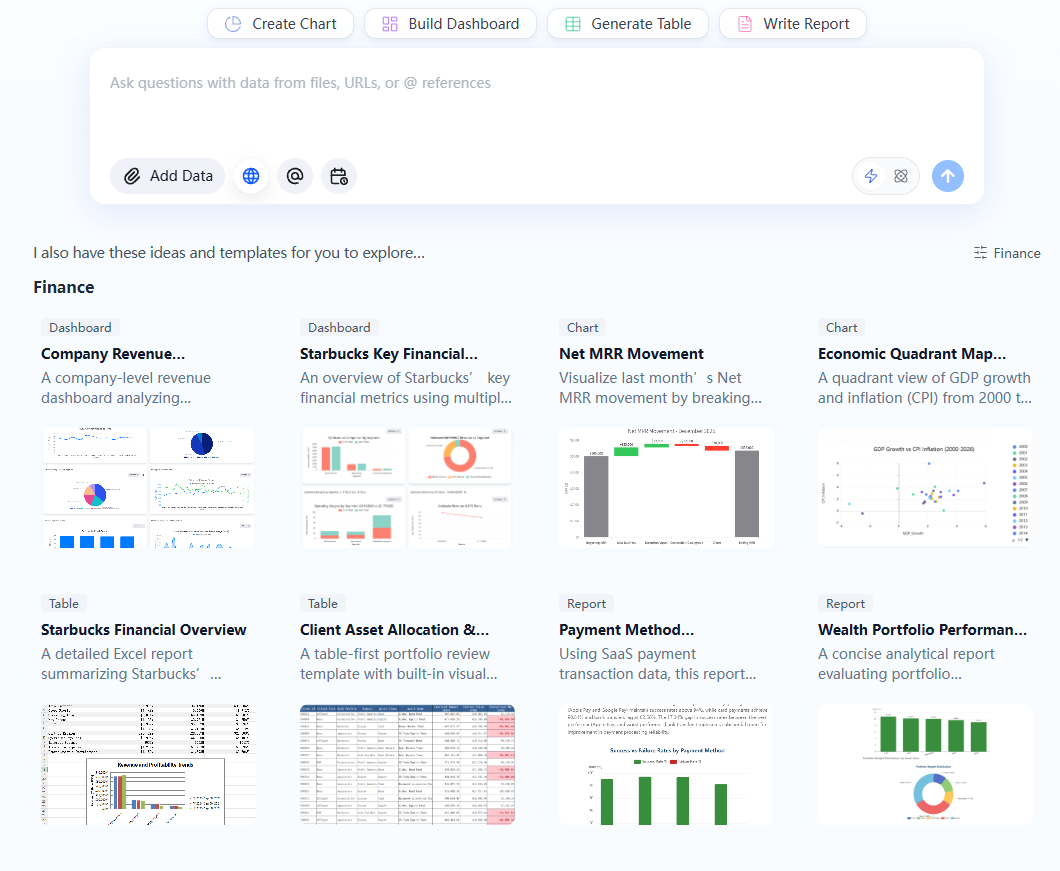
ChartGen AI empowers you to instantly initiate core analytical tasks and generate deliverables directly from the interface: create charts, build comprehensive dashboards, generate tables, design diagrams, compose insightful reports, or assemble professional presentations.
Beyond direct queries, accelerate your analytical journey with our curated templates. Tailored to your industry choice during onboarding, these templates offer relevant recommendations that better reflect your real use cases, helping you get started faster or serving as a valuable reference when you're unsure where to begin.
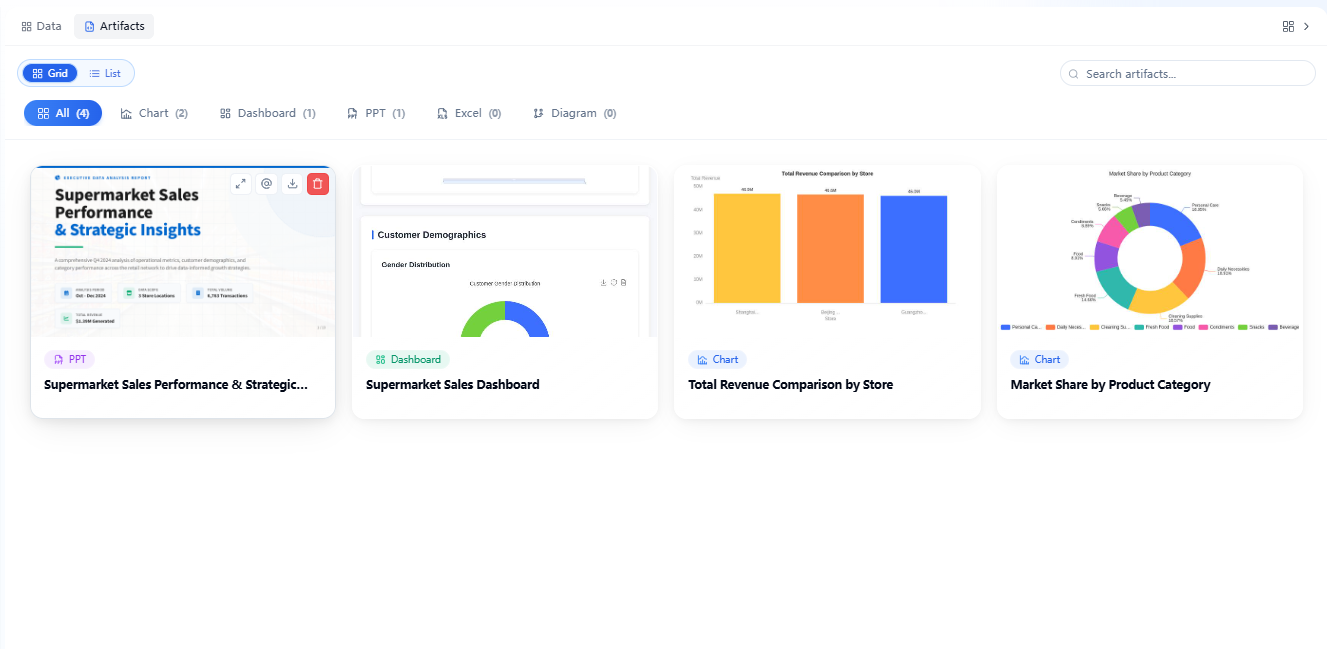
Artifacts Management
The Artifacts panel serves as a centralized hub for managing all your AI-generated deliverables. Every deliverables created during your analytical conversations is automatically saved and organized here for seamless retrieval. The intuitive interface allows you to efficiently navigate your growing repository: you can instantly switch between grid and list layouts, filter by specific categories, or utilize the search bar to rapidly locate deliverables by keyword.
To maintain a fluid analytical workflow, each artifact card provides immediate quick-access controls. Directly from the interface, you can expand an asset for a full-screen detailed view, @mention it to seamlessly reference the item in your active prompt for further analysis, download it for external use, or delete it to keep your workspace organized. Furthermore, simply clicking on any deliverable instantly navigates you back to its original context within the conversation history.
AI Edit
AI Edit is built directly into the main conversation workflow and works across every artifact type, including charts, tables, dashboards, diagrams, reports, and presentations. There is no separate editing mode — you simply describe what you want to change in the chat.
Two ways to edit:
Edit directly in the chatbox: Type your edit request in natural language, specifying which artifact to modify and what to change. ChartGen AI applies the change inline.
@ the Artifact: @mention the artifact you want to modify and describe your request — whether adjusting structure, adding content, or changing the presentation style.
You can target any historical version of an artifact for editing, either through natural language prompts or the @ reference method. If no specific version is selected, ChartGen AI modifies the latest version by default. Every edit is safely tracked, so you can switch between historical versions at any time.
AI Edit is available to all users, including those on the Free plan.
Charts & Visualizations
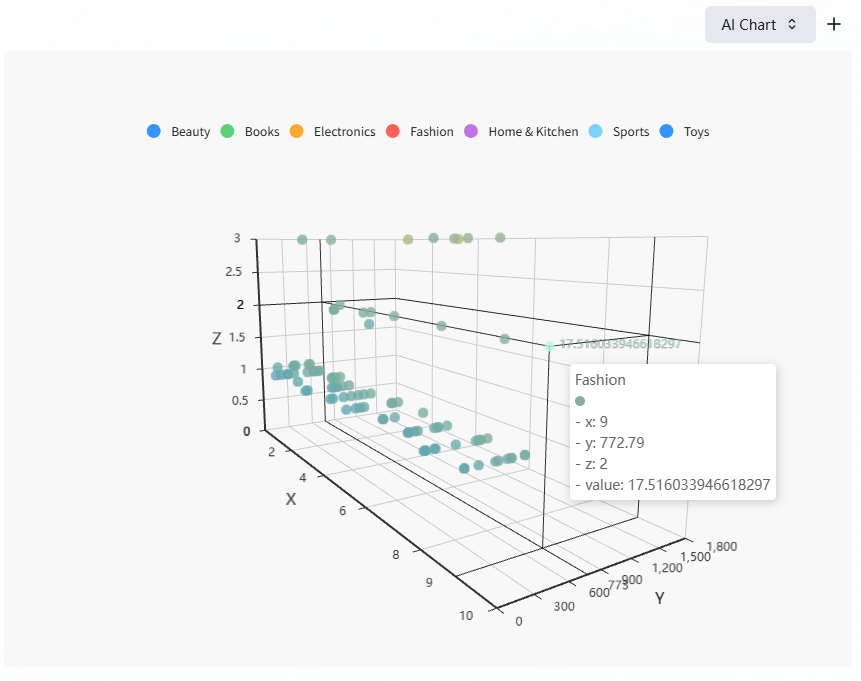
ChartGen AI turns query results into clear, intuitive charts to help you quickly spot trends, anomalies, and comparisons across dimensions. You can either specify a chart type directly in your prompt, or let ChartGen AI infer your intent and the data shape to automatically choose the most suitable visualization during analysis to support and explain insights.
We support a wide range of visualization types, within the same conversation, you can refine metrics, filters, groupings, chart type, colors, or styling, and each update regenerates the chart based on your latest instructions.
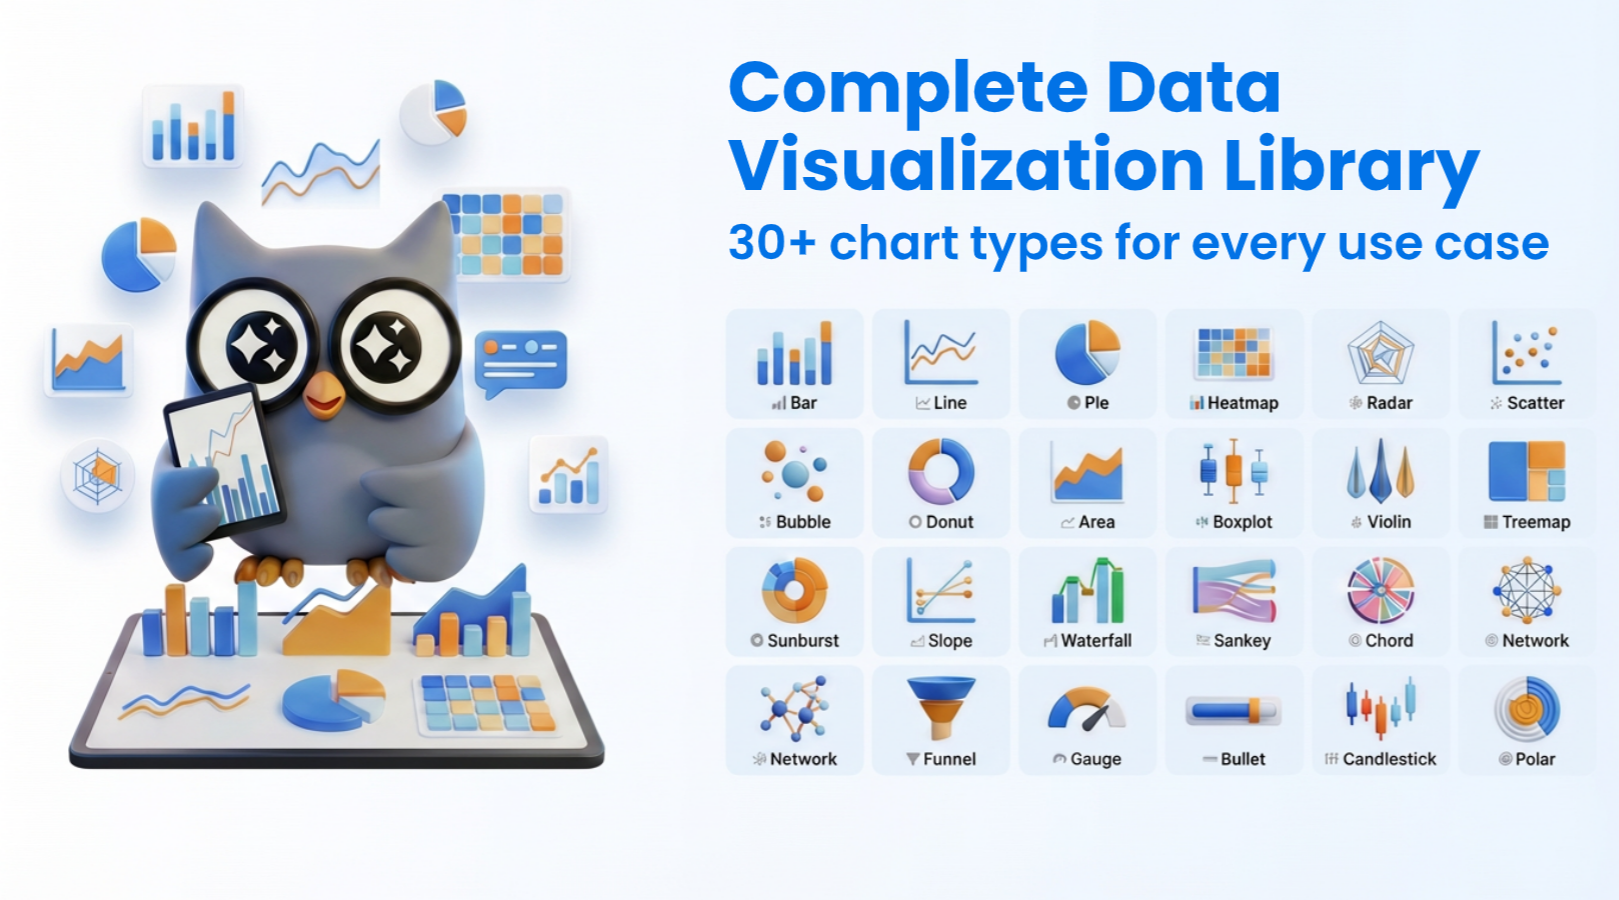
The image below shows an example:
Dashboard
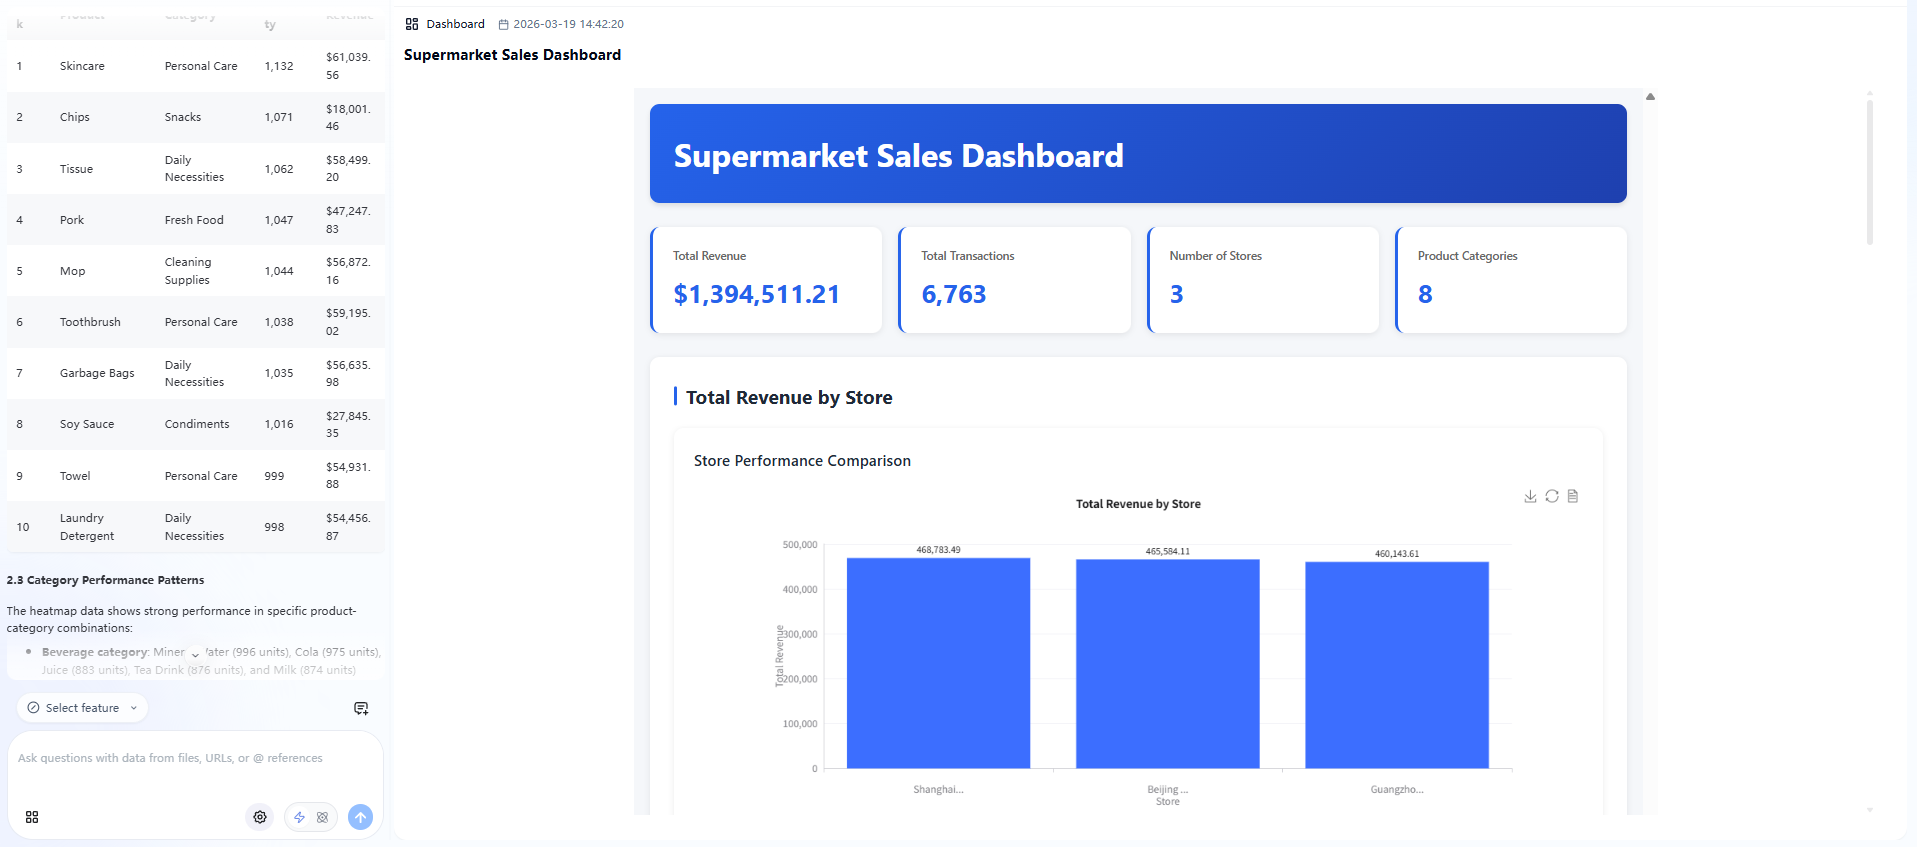
A Dashboard consolidates deliverables from multiple conversations into a single, reusable space with a clean, professional layout. Use the Build Dashboard quick action in chat, and ChartGen AI automatically arranges relevant charts, tables, and contextual summaries into a structured layout. Color palettes adapt to the context of your query, and the most important findings appear as inline annotations on each chart, so critical takeaways are visible at a glance.
For multi-project management, Dashboards are organized into thematic tabs — switch between them to navigate different areas of analysis within the same workspace.
Every chart or component within a dashboard can be downloaded individually, making it easy to organize, review, and share analytical outputs without manual assembly.
Extract Data
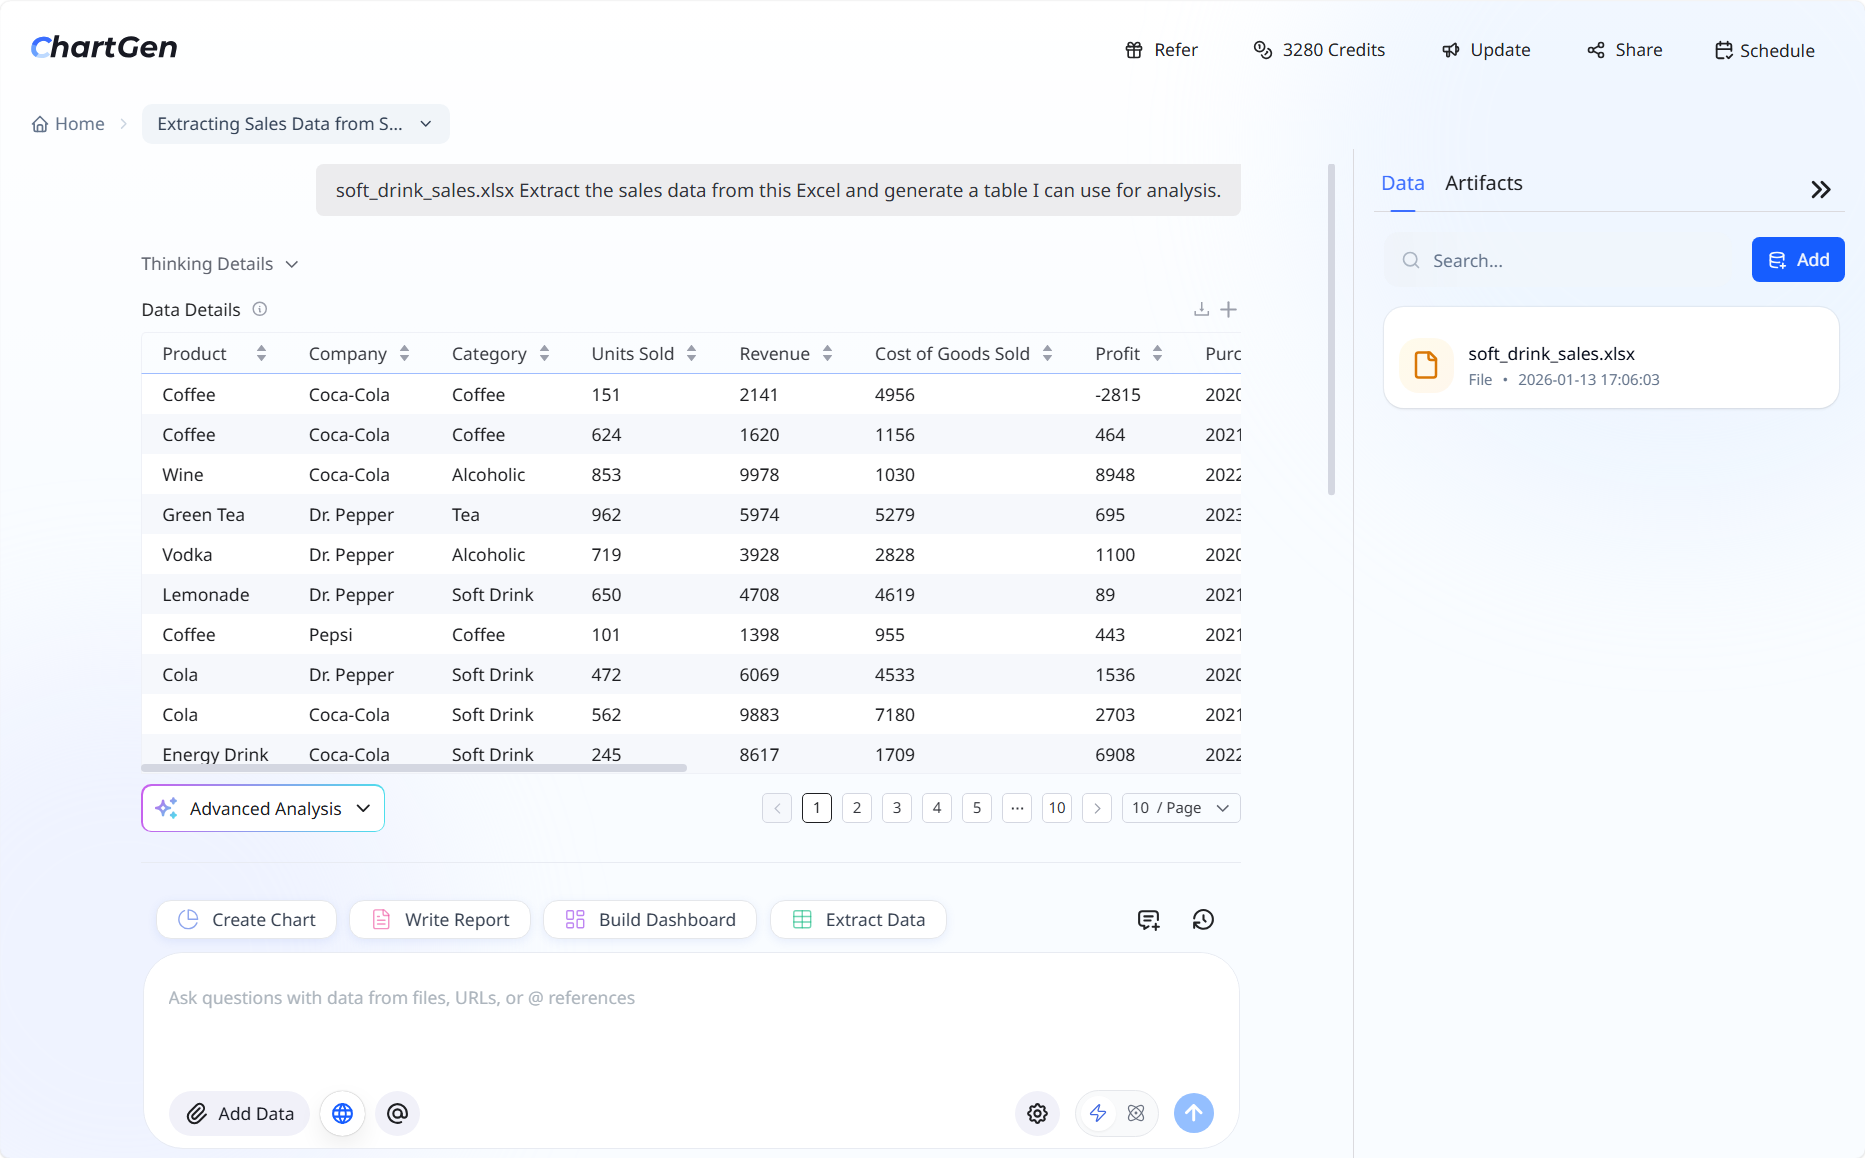
Extract Data generates new structured tables based on the data you already have. Describe the columns or metrics you need, and ChartGen AI derives them from your existing dataset and outputs the result as a downloadable table.
Common use cases include:
- Adding a derived column to an existing table (e.g., calculating a profit margin from revenue and cost columns).
- Building a new feature for downstream analysis (e.g., customer tiers, retention windows, weighted scores).
- Reshaping or aggregating an existing dataset into a new tabular layout.
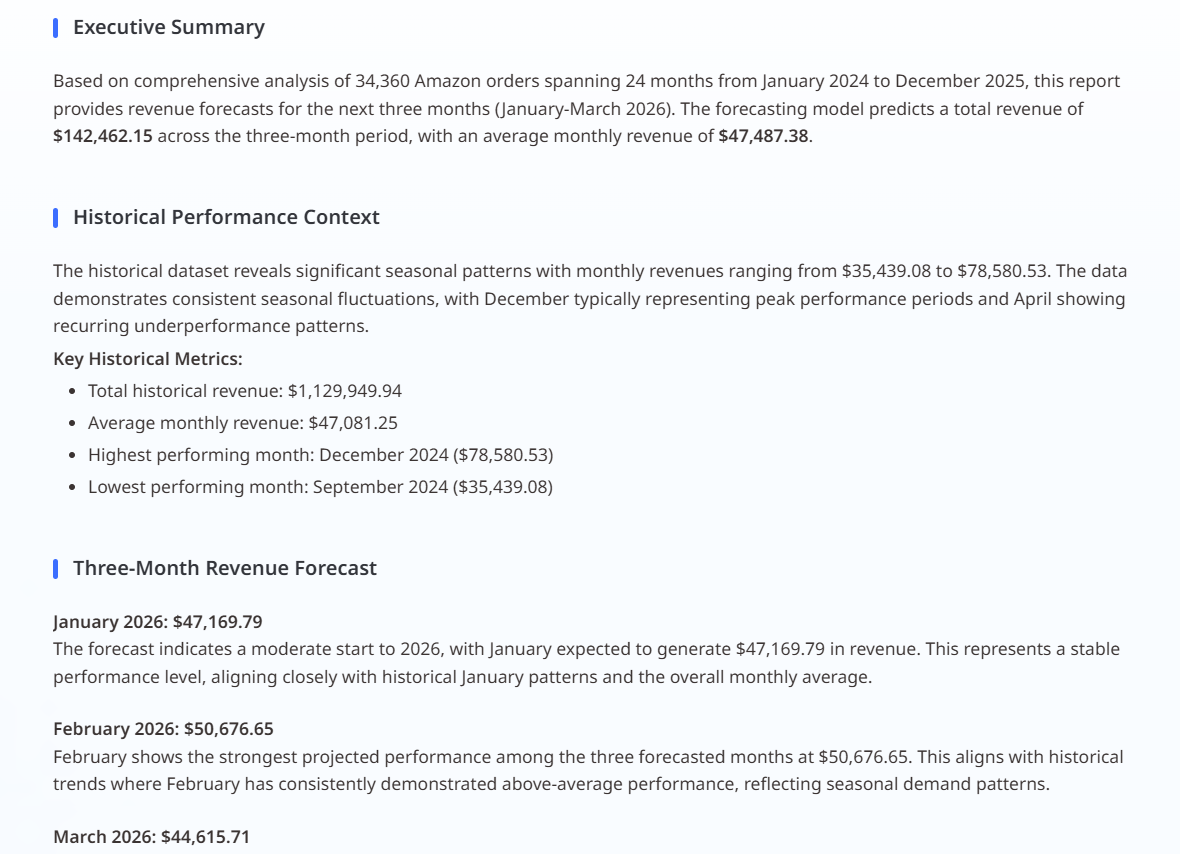
Reports
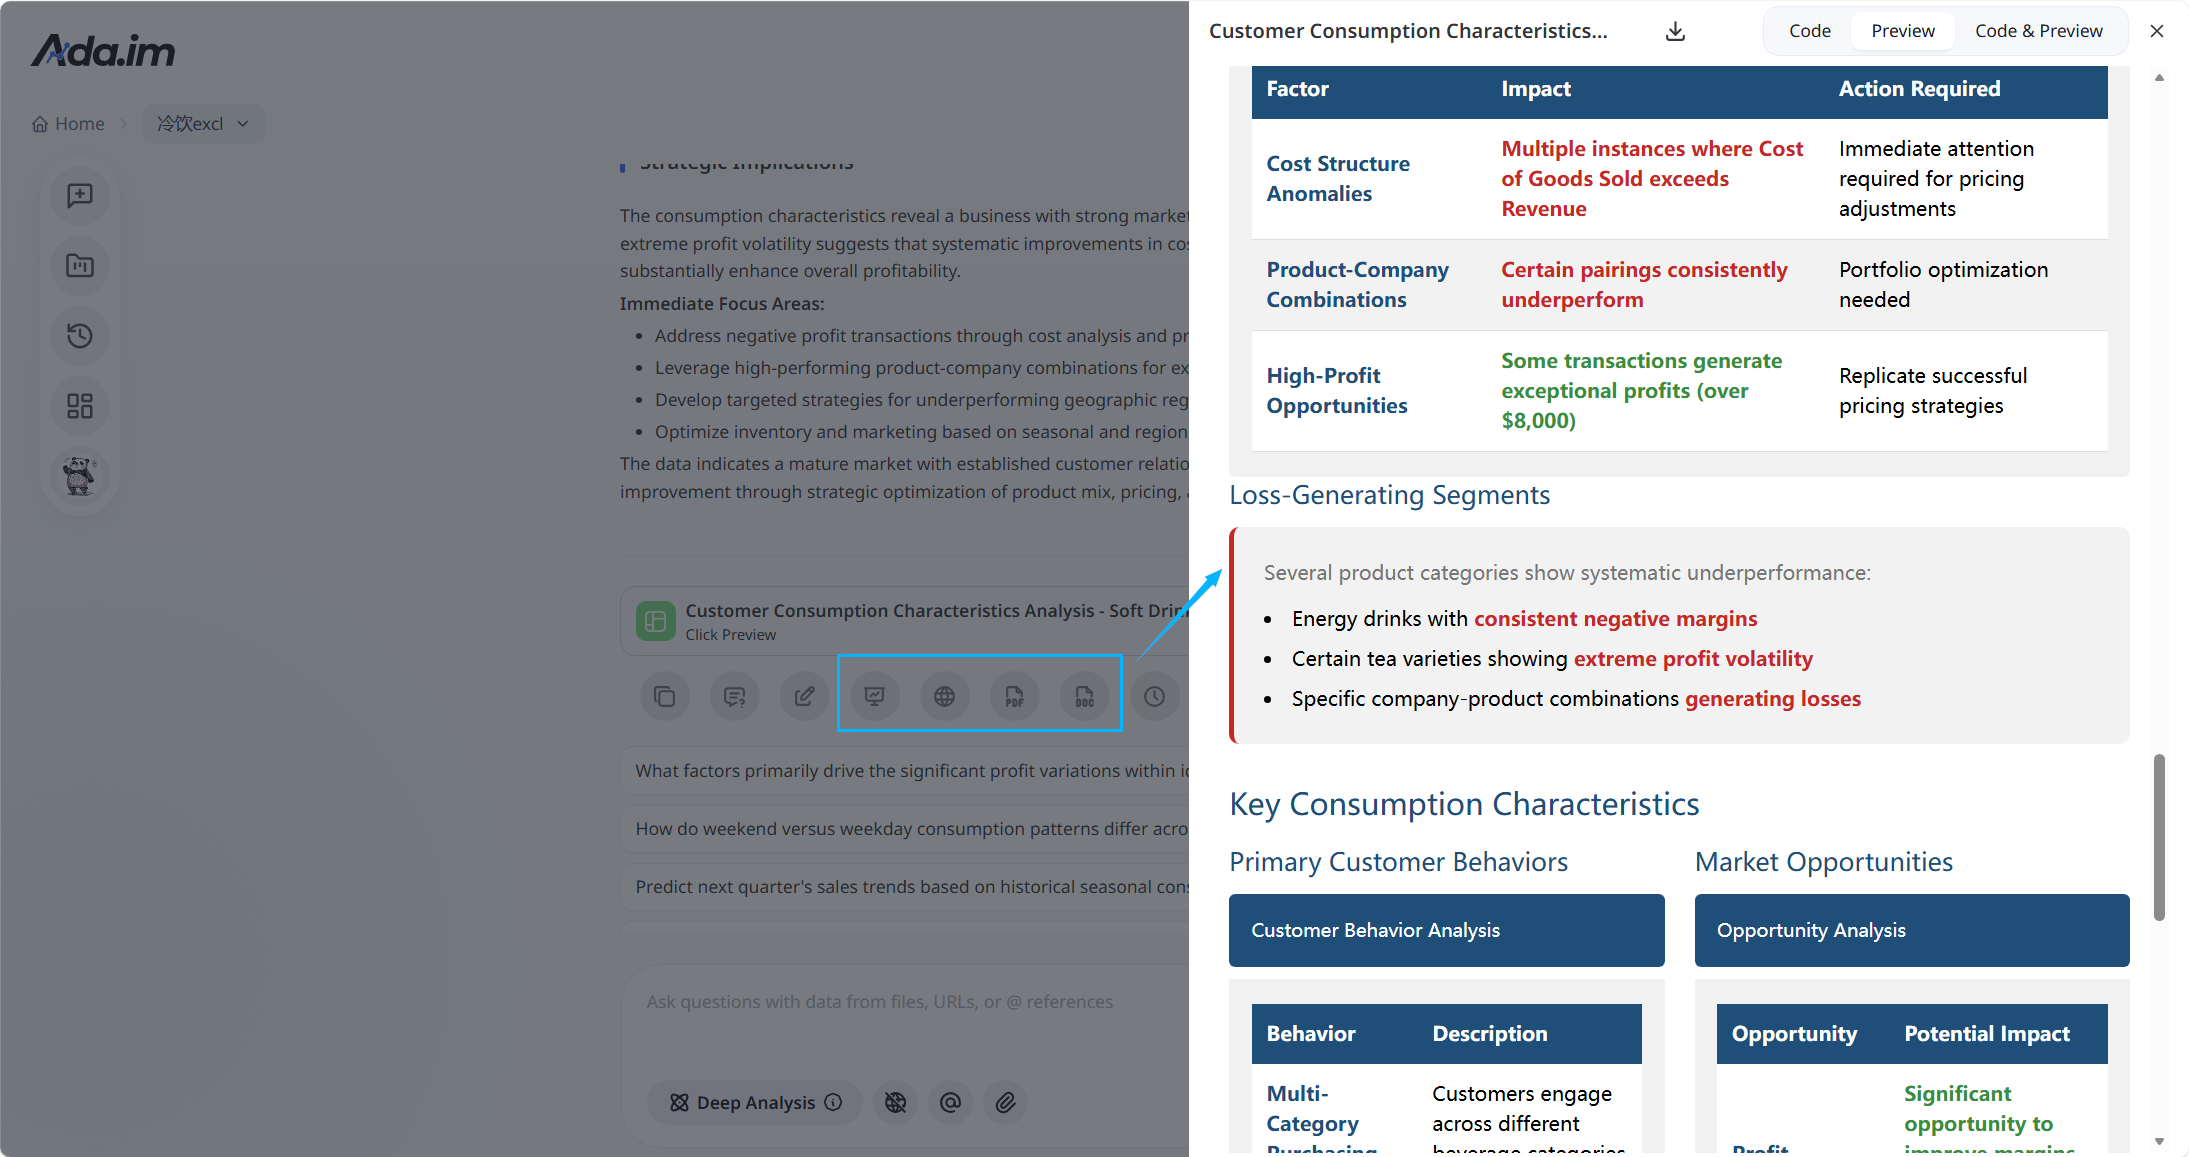
By simply clicking the Write report button on the homepage and submitting a natural language query, you trigger the full-scale report generation process.
Unlike instant query tools, ChartGen AI runs a long-form reasoning chain and produces professional-grade reports with charts, tables, and insights—typically within 5–15 minutes.
The system first generates results in Markdown (MD) format, and users can convert the content into multiple formats using the export buttons at the bottom of the page.
HTML and PPT: Enhanced deliverables generated based on the MD and the user’s query, with visualization and structured layouts. Word and PDF: Direct downloads of the MD content itself, suitable for archiving or sharing.
Tip: Enable the “Deep Analysis” button in the input box to get a more in-depth and comprehensive report.
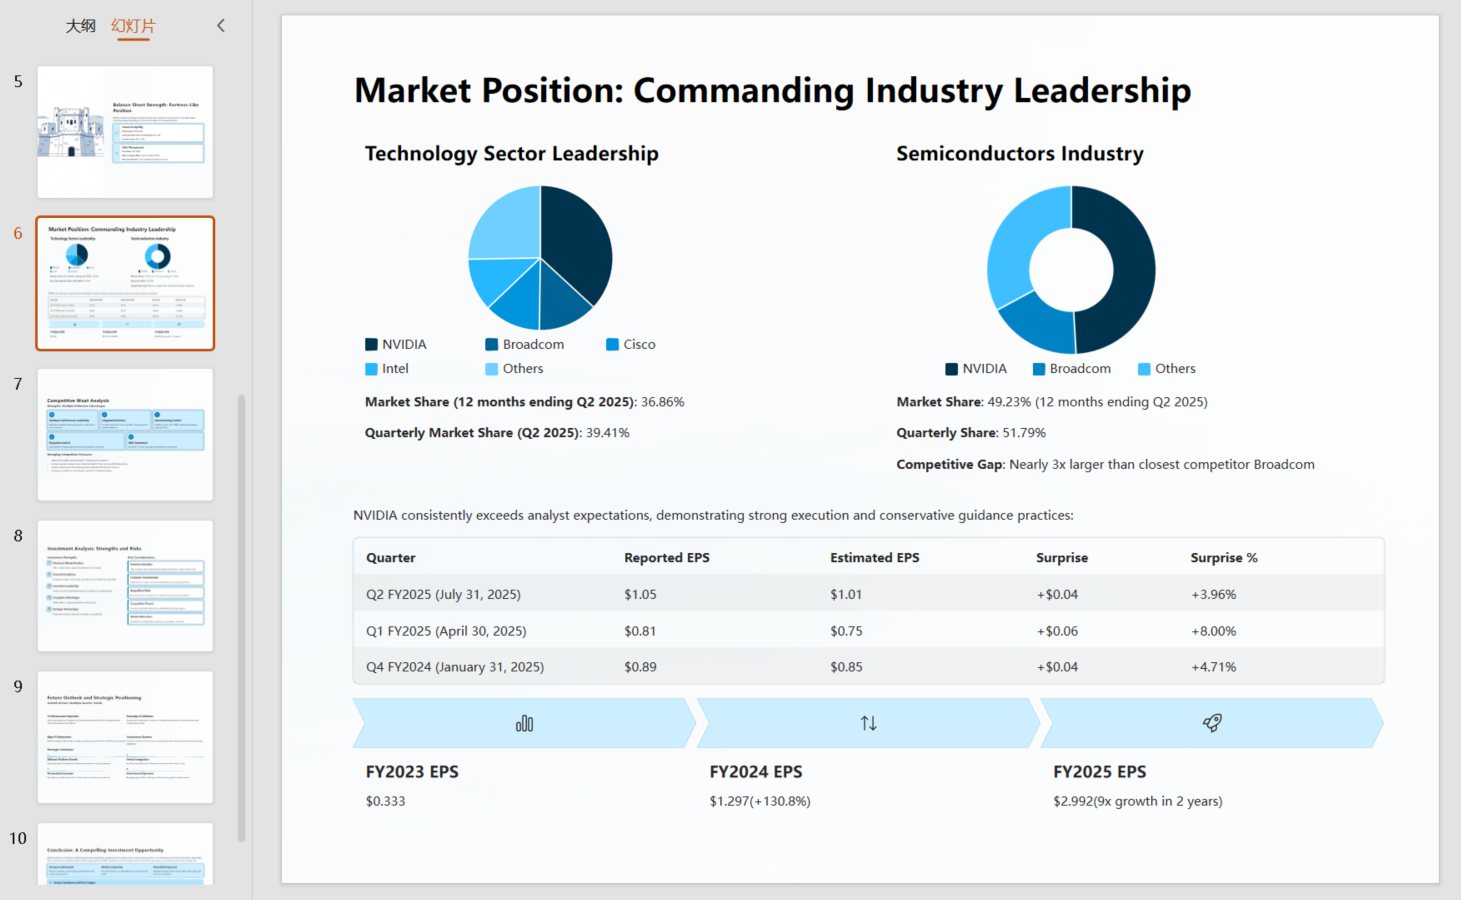
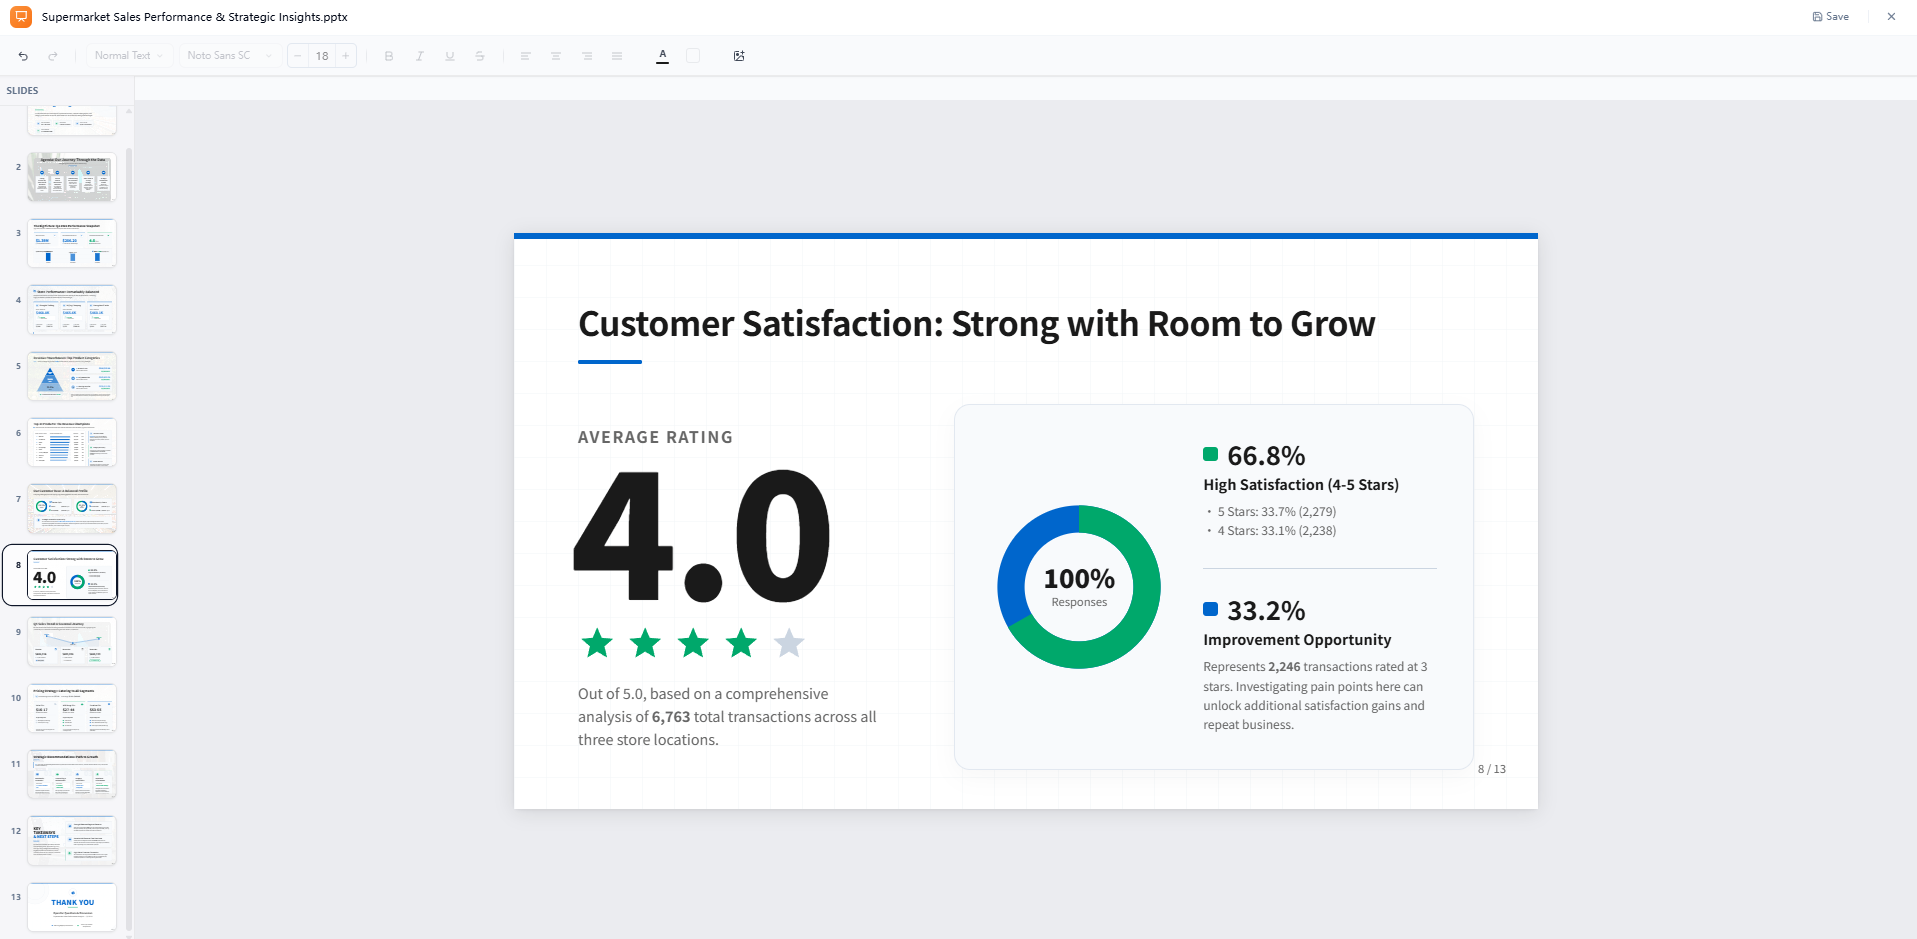
PPT
ChartGen AI also translates your analytical findings into professional presentations. Rather than merely compiling isolated charts, the AI automatically constructs a cohesive, fully structured business narrative—seamlessly integrating essential components like data overviews, deep-dive insights, actionable next steps, and standard concluding remarks into a complete slide deck.
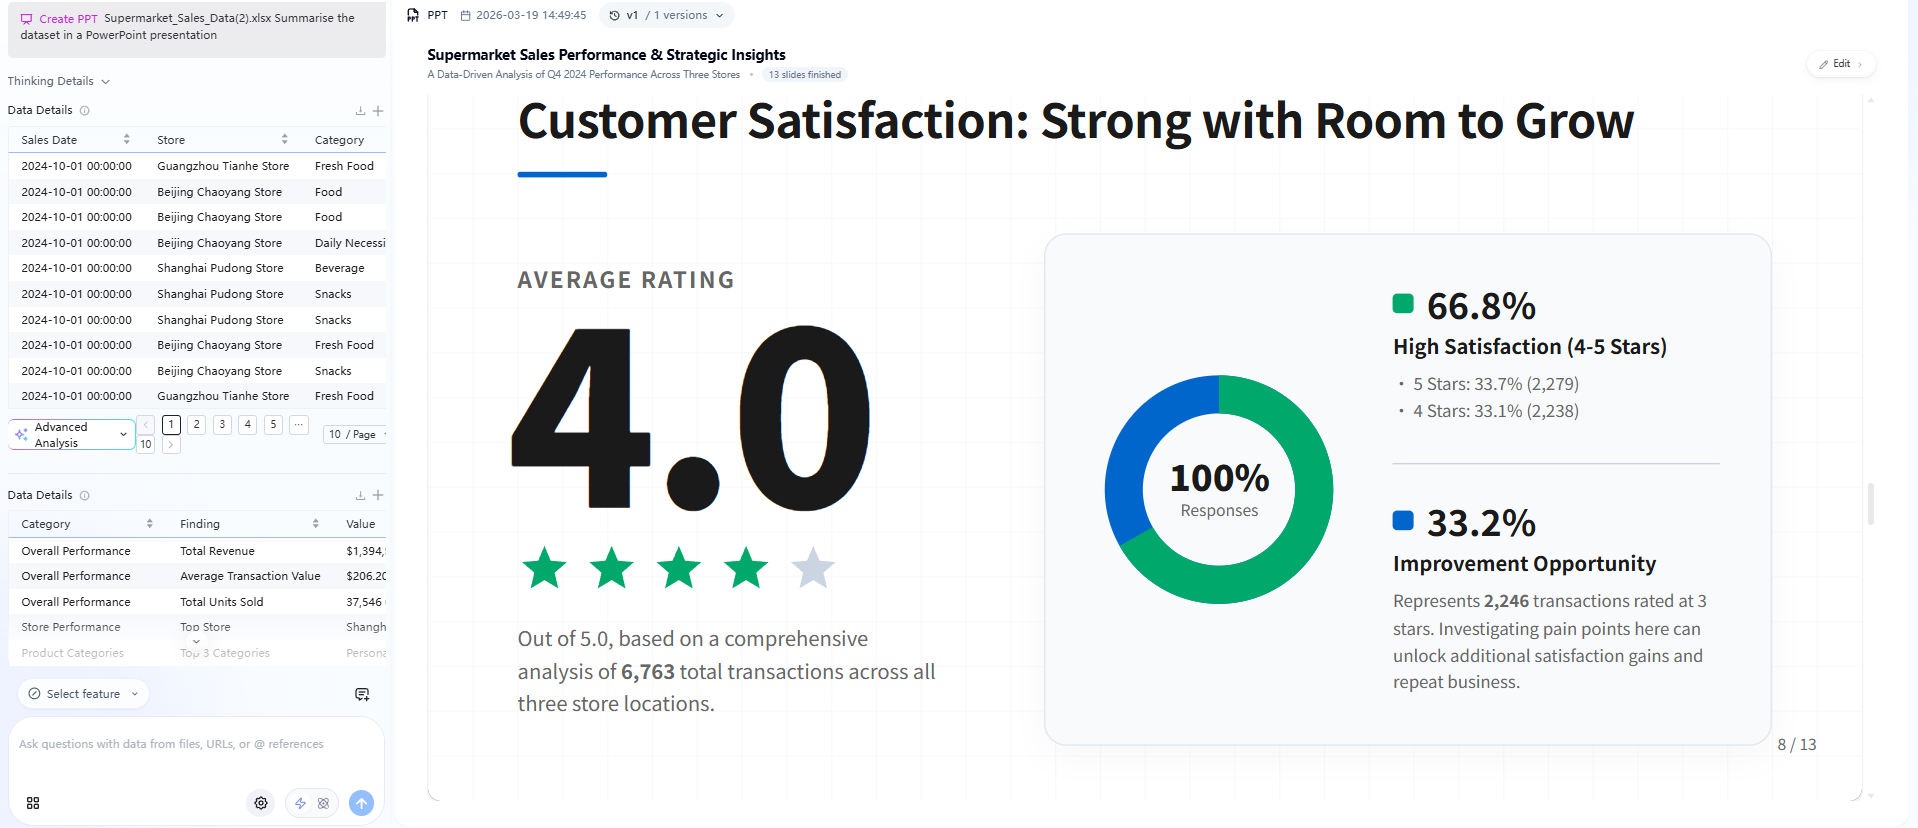
To provide a end-to-end workflow, ChartGen AI features a built-in presentation editor. This native interface allows you to instantly review, modify text, and refine slide layouts directly within the platform without switching applications. Once your deck is polished, you can download the final output in standard .pptx format.
Diagram
Beyond data charts, ChartGen AI generates a wide range of structured diagrams to help you organize ideas, map processes, and visualize relationships. The diagram library covers a broad set of formats, including:
Mind Maps — for brainstorming, structuring topics, and breaking down concepts hierarchically.
Flowcharts — for mapping processes, decision trees, and workflows.
Class Diagrams — for modeling technical concepts, system architecture, and object relationships.
And more diagram types are available alongside these.
You can generate any of these directly from a natural language prompt — no design tool required. Once a diagram is created, it lives in your Artifacts panel like any other deliverable, where you can refine it through AI Edit, download it, or include it in dashboards and reports.
Share
Any content generated in ChartGen AI—whether it's a chart, a table, a dashboard, or a report—can be shared instantly and securely with a single click.
You can choose to share the entire conversation, giving viewers the full analytical context including your prompts, ChartGen AI's reasoning, and every artifact produced along the way, or share only the final artifact when the audience just needs the polished deliverable.
By selecting Share in the top-right corner, users can generate a shareable link or quickly distribute content across platforms such as X (Twitter), LinkedIn, Facebook, and Reddit.
This on-demand sharing makes it easy to turn ongoing analysis into something others can view, discuss, and act on.
Project: Making Analysis Long-Term
A Project is the core unit ChartGen AI uses to support long-term analysis. It is designed for scenarios where questions, data, and decisions accumulate over time. Instead of treating each question as an isolated interaction, a Project provides a stable context so analysis can continue, deepen, and become more accurate as more information is added.
You can enter a Project by clicking the New Project button on the homepage, or simply by asking a question in the homepage dialogue box, which will automatically create a new Project based on your inquiry.
Why We Create a Project
Most analytics tools excel at answering a single question: ask—get a result—end. But in real-world business analytics, analysis is often ongoing. For example, in e-commerce, the same dataset is used repeatedly: you continuously upload the latest week’s order data, and conclusions must be compared across time periods.
When analysis is isolated, you have to re-explain the context and rebuild the logic every time. By centrally managing data, context, and the analysis process, Projects avoid this repetition and allow analysis to progress over the long term around the same business goal.
What Lives Inside a Project
A Project centrally manages everything needed for continuous analysis, including: Your private data
- Data and analytical artifacts generated in conversations
- AI dashboards for long-term monitoring
- Instructions that define project context and analysis preferences
- Scheduled tasks for recurring analysis
- Project-level memory
Meanwhile, ChartGen AI proactively provides recommended questions and insights based on the current context to help you continue and deepen the analysis. All of these live within the same Project and evolve as analysis progresses.
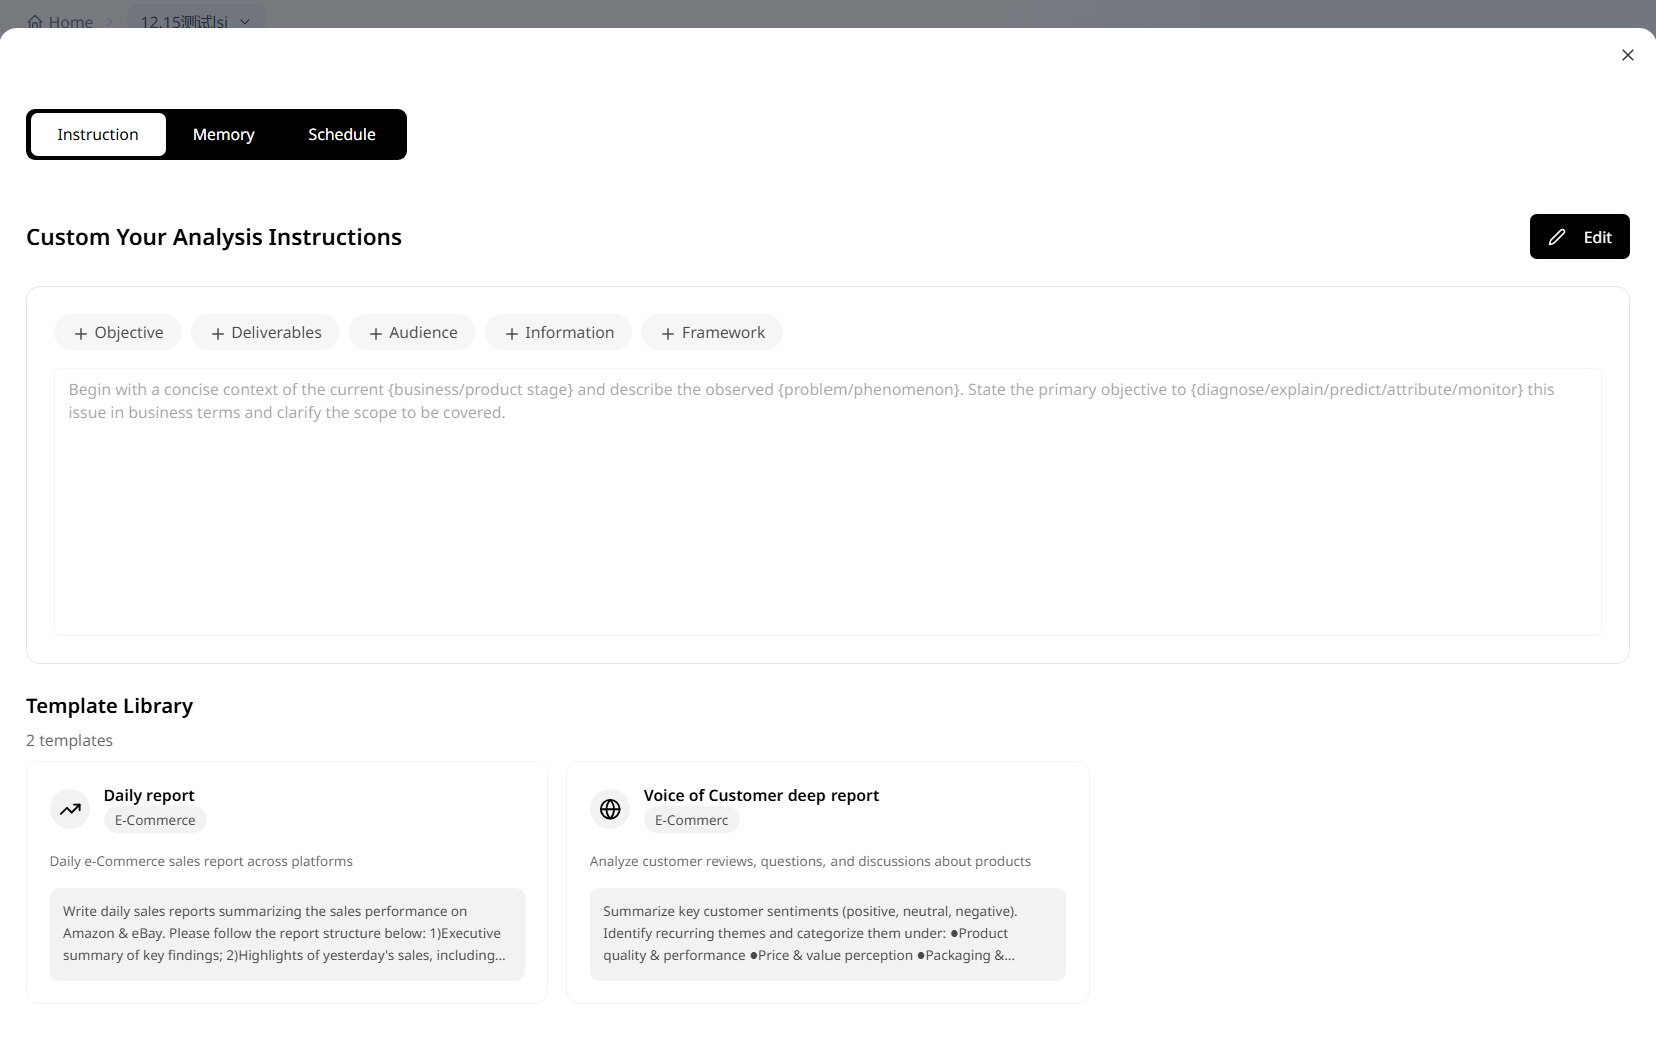
Instruction
Instruction describes the current Project’s context and analysis expectations, helping ChartGen AI understand your analysis preferences and desired output format. You can find Instruction in the Project settings at the bottom-right of the chat window, and you can edit it at any time.
You can specify details such as the audience, business context, specific analysis requirements, output format, and writing style. Keep it concise and clear, and state key preferences directly to achieve more consistent and controllable analysis results.
Note: The Project’s Instruction is applied in every conversation.
Example
1.Summarize key customer sentiments (positive, neutral, negative).
2.Identify recurring themes and categorize them under:
- Product quality & performance
- Price & value perception
- Packaging & delivery experience
- Customer service & warranty
- Competitor comparisons
3.Extract exact customer quotes that illustrate these themes.
4.Highlight unmet needs or opportunities for improvement.
5.Identify emerging trends (e.g., new feature requests, shifting preferences).
6.Provide a summary table:
| Theme | Customer Sentiment | Representative Quote | Frequency | Actionable Insight |
7.Output Style:
- Use concise analytical language suitable for a product or marketing strategy report.
- Separate sections for Insights, Quotes, and Recommendations.
- Keep tone professional and evidence-based.
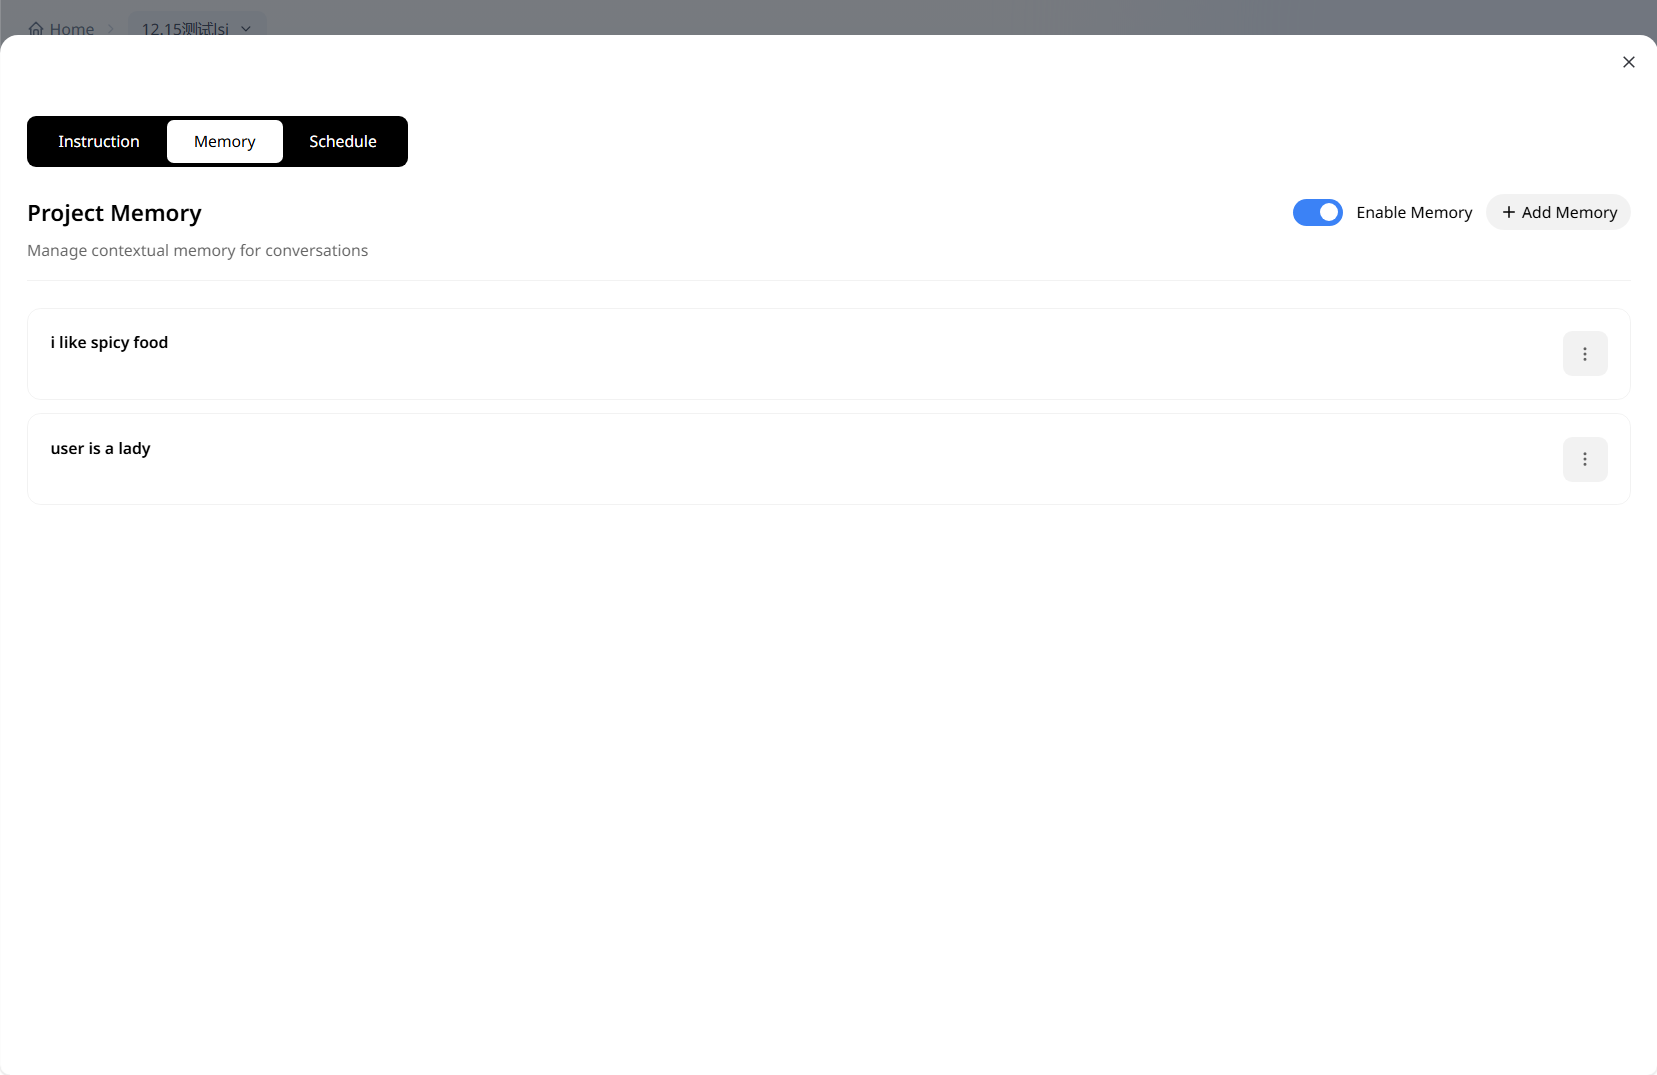
Project Memory
Project Memory reduces the need to repeatedly explain and clarify requirements during long-term analysis. It records confirmed important information within a Project—such as stable business requirements, commonly used metrics, key definitions, or analysis preferences—so you don’t have to restate them in future conversations.
You can create, view, and manage Project memories in the Project settings at the bottom-right of the chat window. During conversations, you can also tell ChartGen AI in natural language what you want it to remember.
Project Memory is best for long-term, stable preferences—not temporary information.
Note: During conversations, we determine whether there are relevant memories to recall, but memory will not be recalled every time.
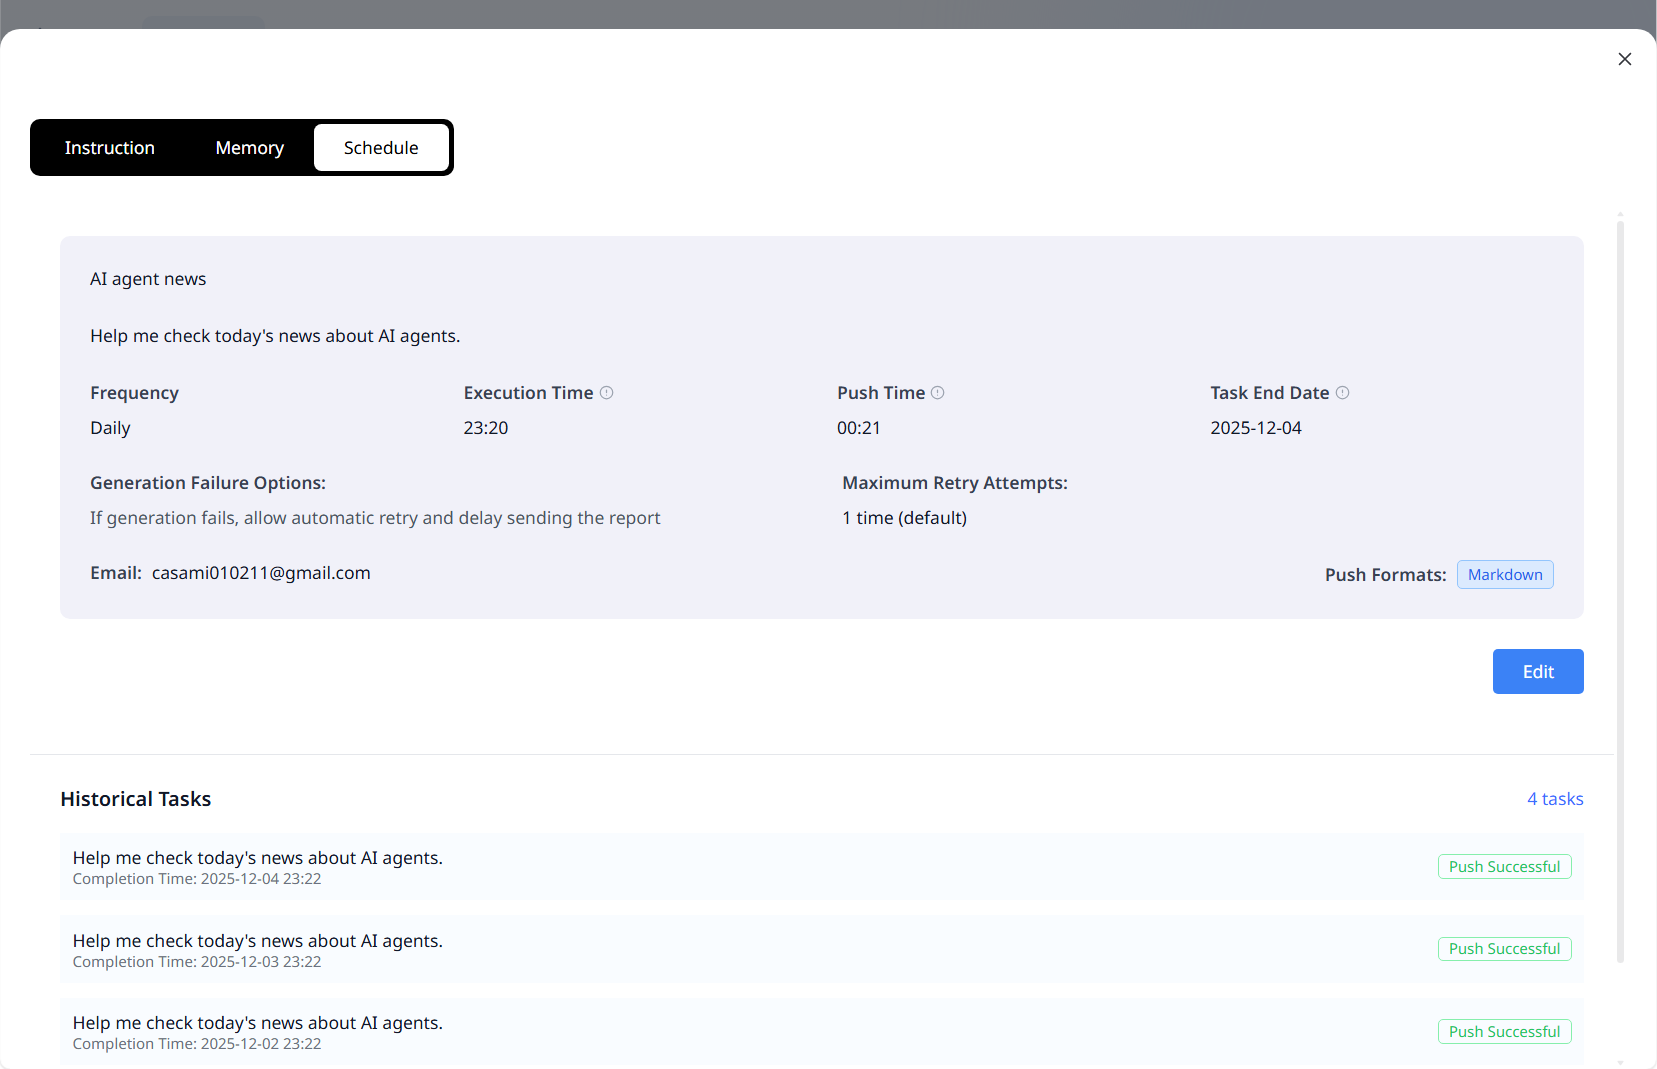
Schedule & Automation
Projects support scheduling and automation for recurring analysis.
Click the scheduled task button at the bottom-left of the chat window to open the configuration dialog. Set the execution time, delivery method, and recipient email (defaults to the email of the current account).
After setup, simply describe the task you want to run on a schedule in the chat. ChartGen AI will automatically run the analysis at the specified time and send the report to you. You can view the schedule status in the top-right of the Project and pause or delete it as needed.
Data Sources for Analysis
Data Sources power analysis in ChartGen AI. By unifying internal datasets, live web data, and third-party APIs, ChartGen AI enables you to transform raw data into visualizations and actionable insights. For data connectors and semantic layer capabilities, see the Data Workbench section.
Internal Data
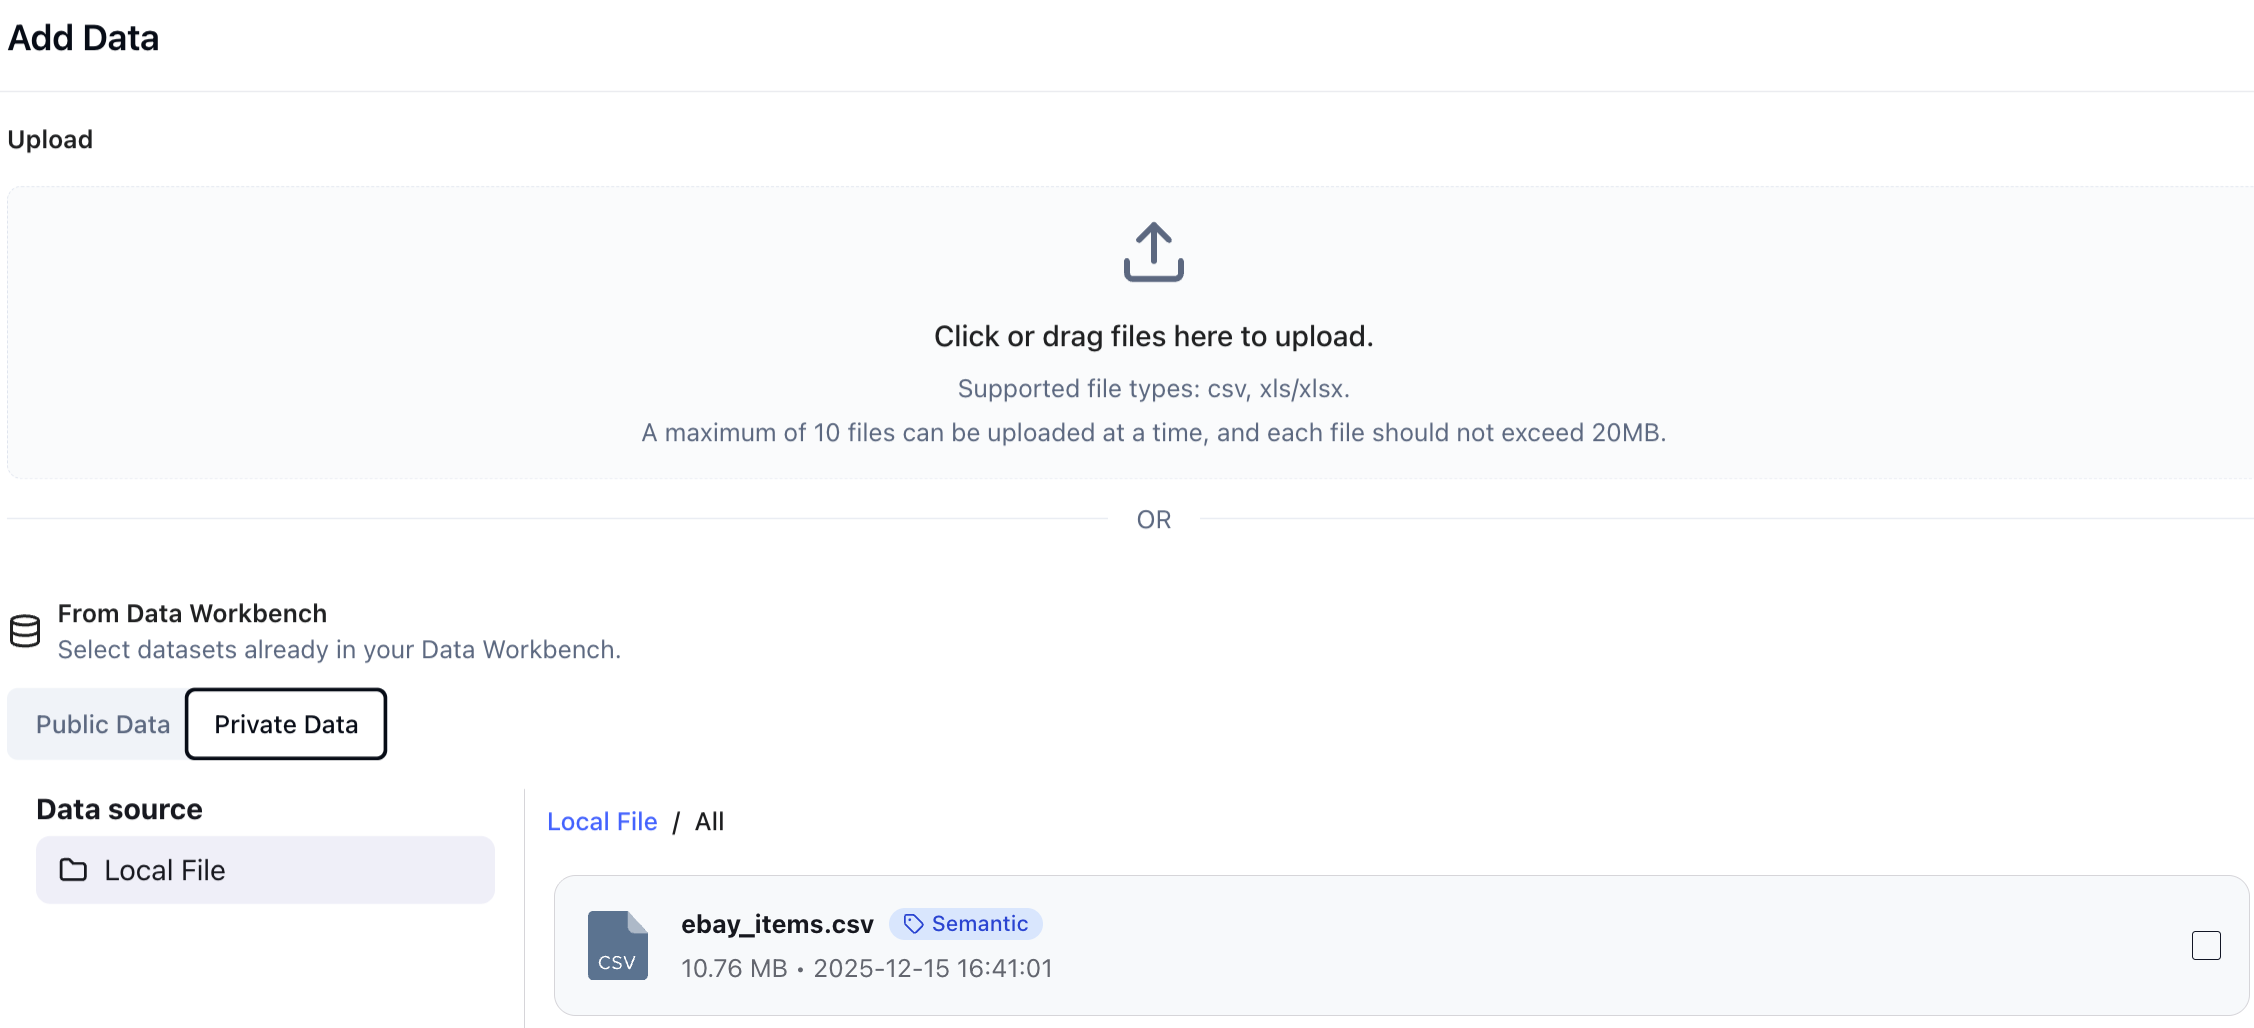
- Private Data
Datasets you upload for personal use. Visible only to you. Best for sensitive information processing, exploratory analysis, and quick artifact generation.
Example
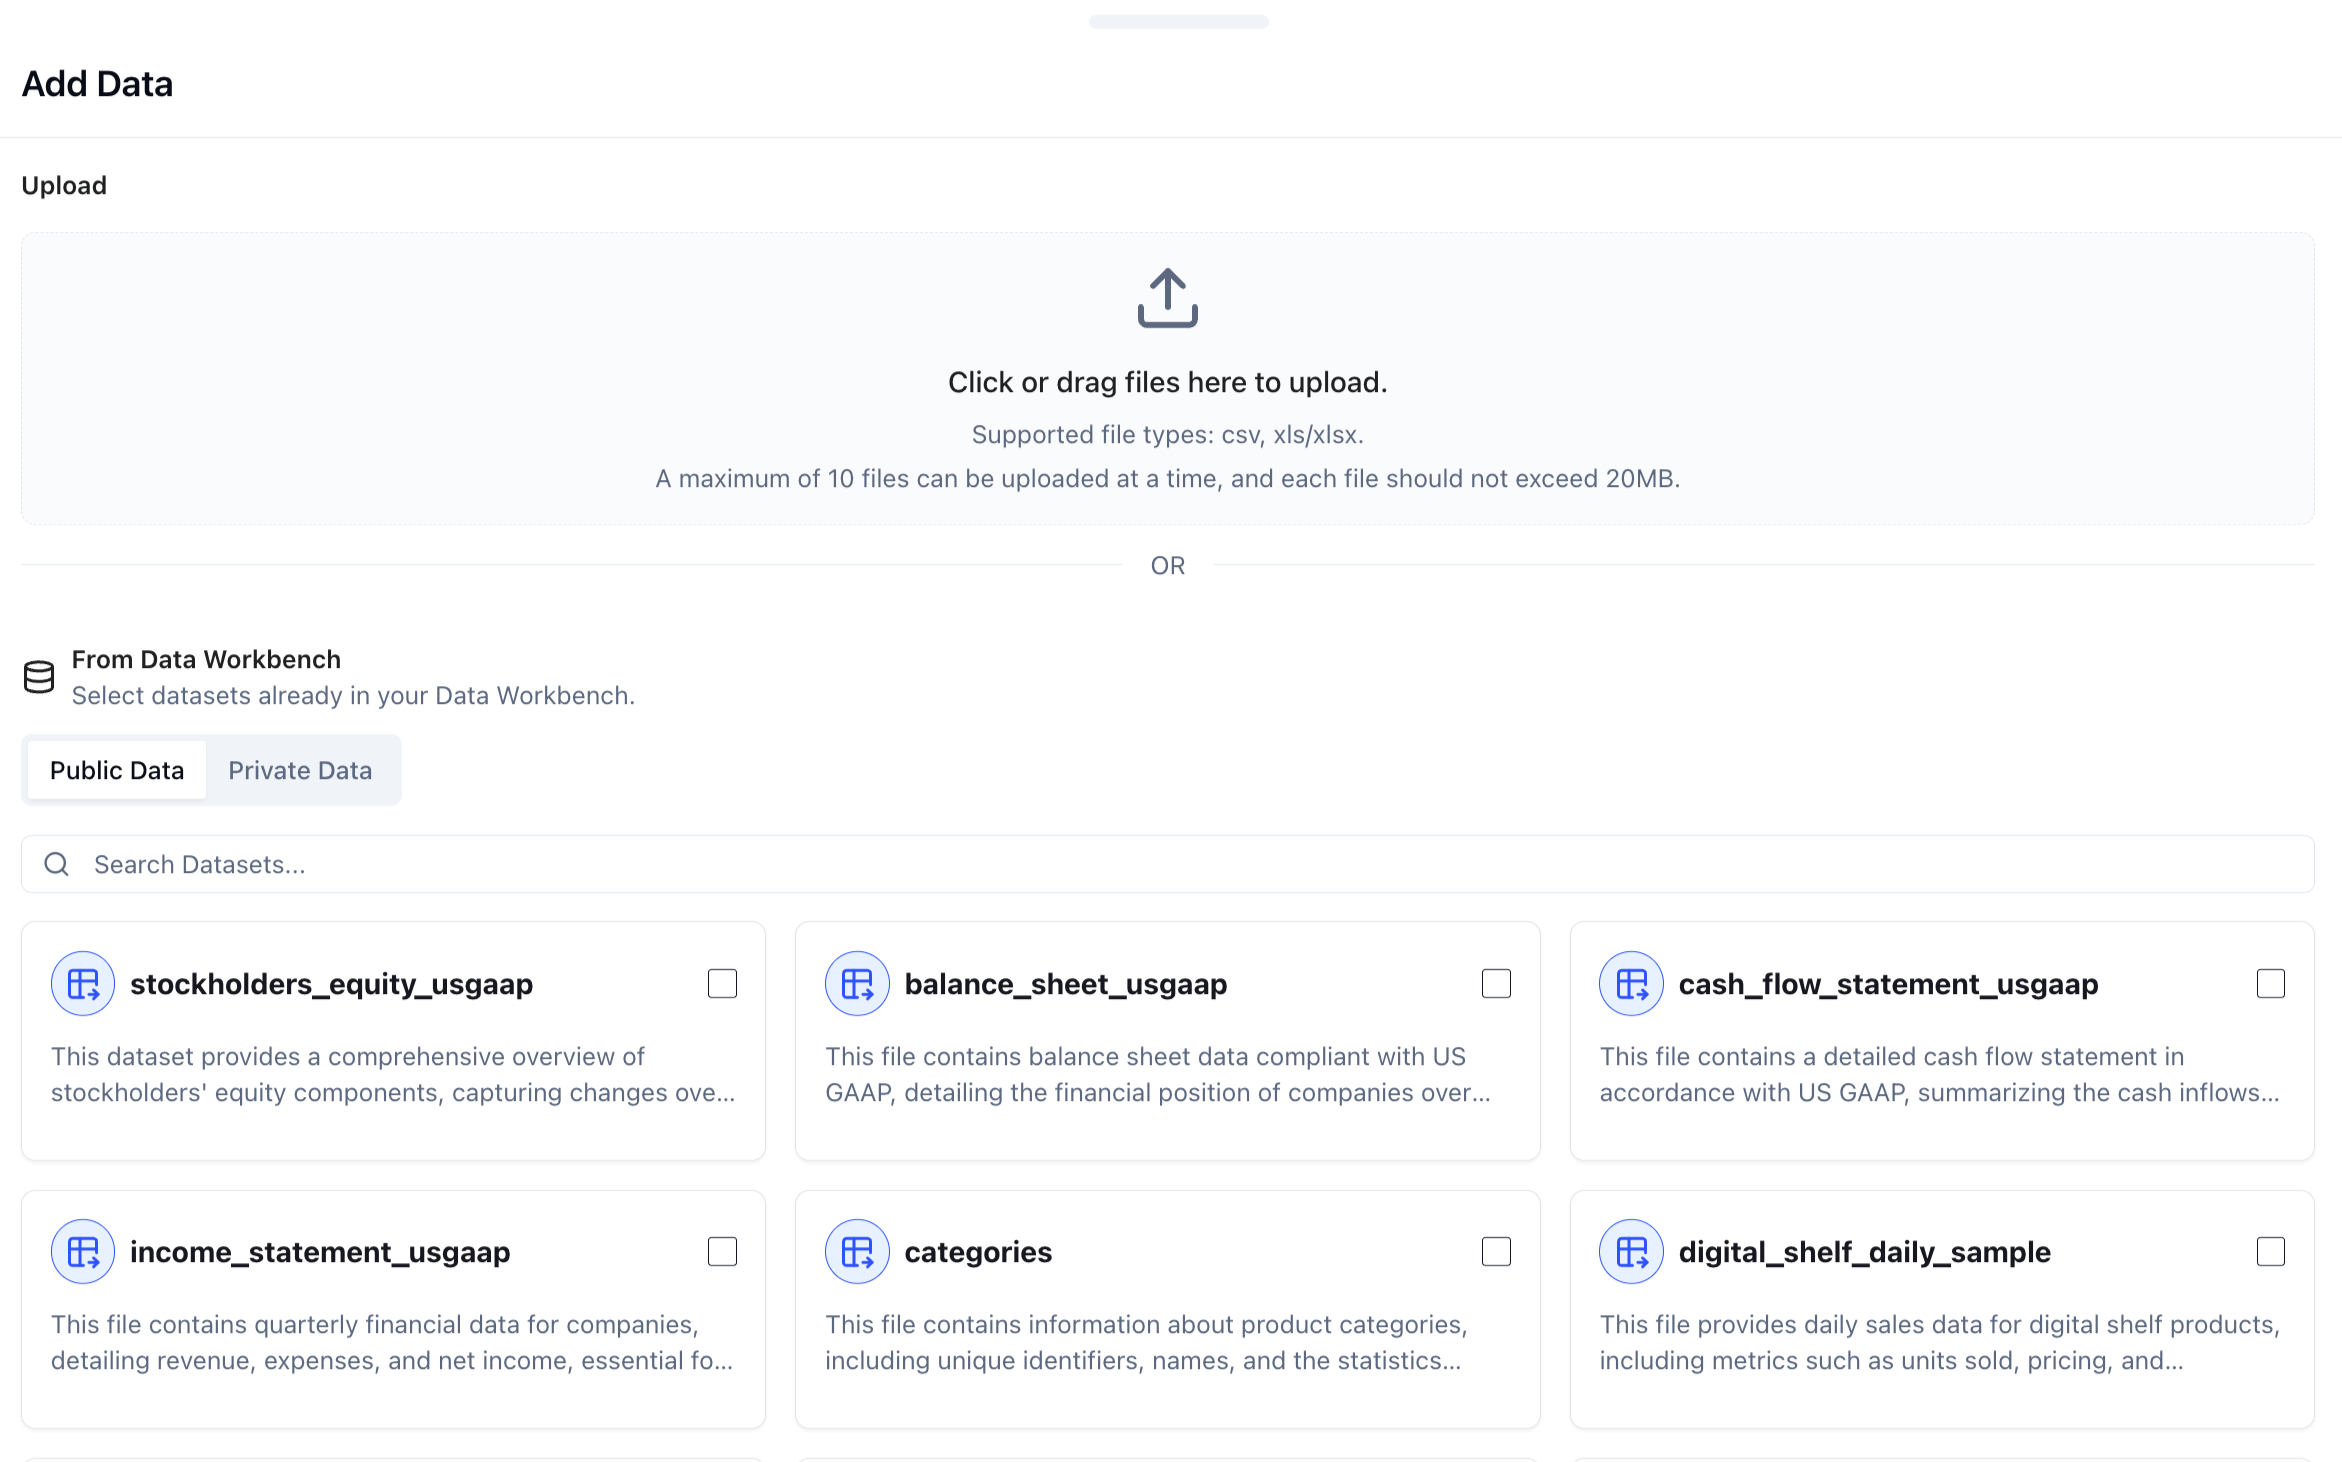
- Public Data
Shared datasets accessible across users. Designed for exploratory analysis, industry research, and cross-team collaboration.
Example
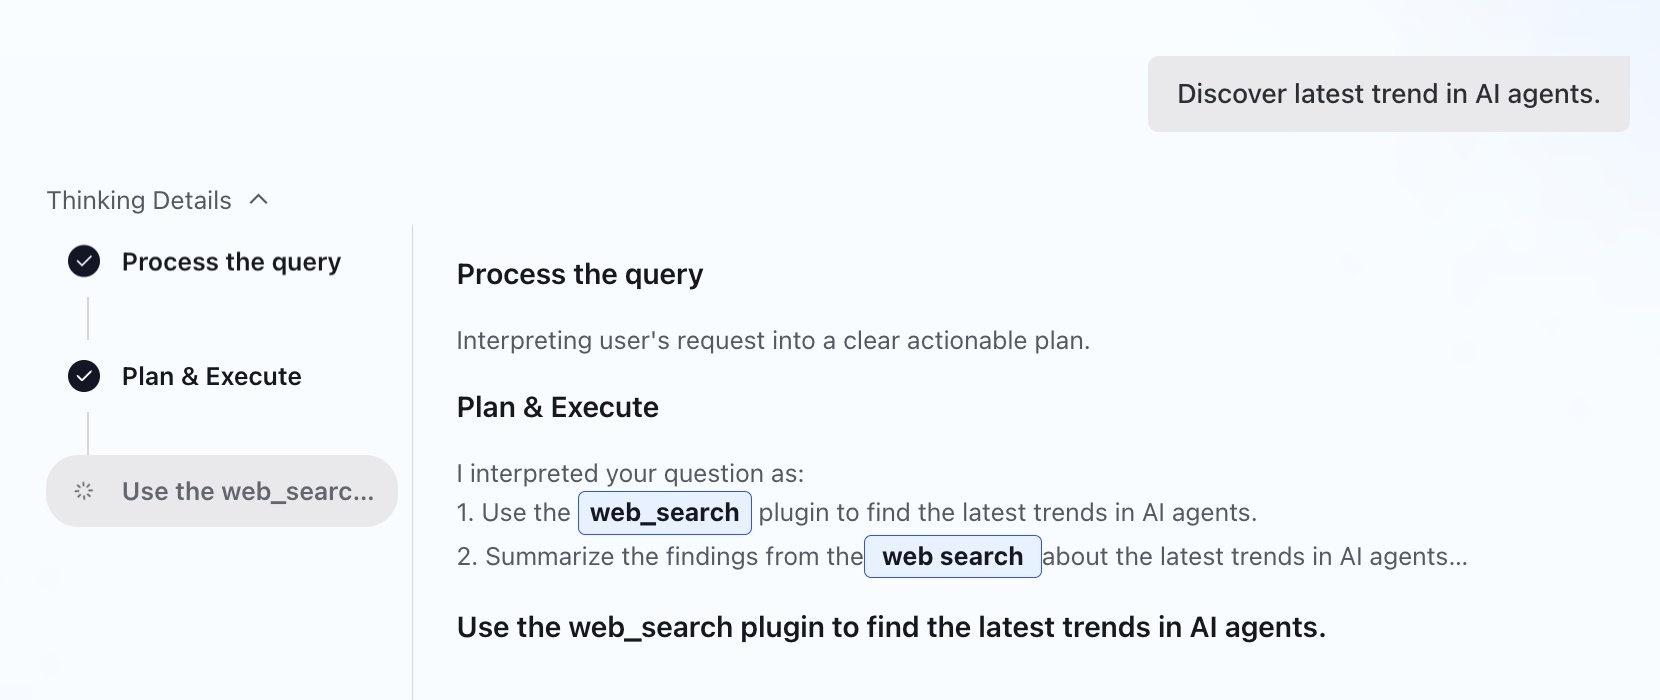
WebSearch
ChartGen AI interprets your query and uses the Web Search plugin to retrieve relevant, real-time data directly into your analysis. No context switching required.
Example
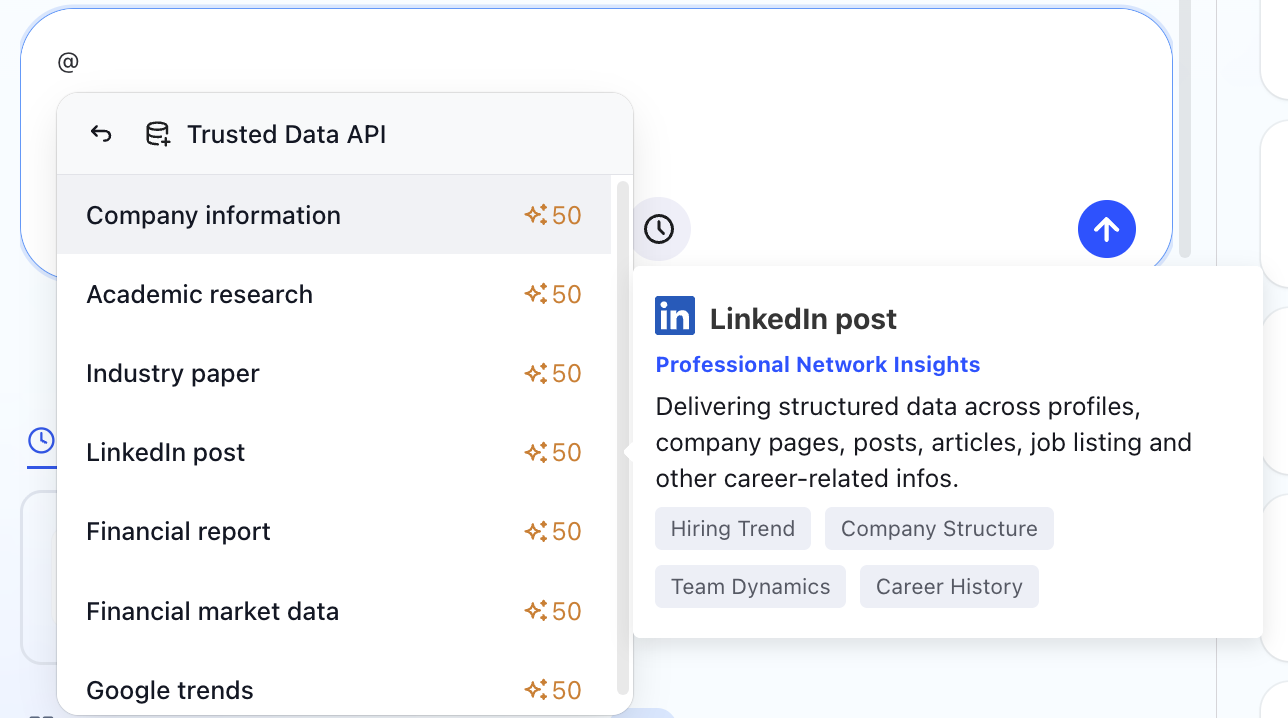
External Data APIs
Connect ChartGen AI directly to third-party APIs to ingest live external data. These APIs deliver structured, domain-specific signals designed for analytical use.
Example
From Analysis to Business Impact
Turning questions into decisions, and decisions into outcomes
ChartGen AI is not just an analytics tool—it is a system that turns data questions into actionable business impact, and continuously reinforces that impact over time.
With ChartGen AI, teams can:
- Use natural language for data analysis queries, including data retrieval, cleaning, and aggregation
- Generate charts, reports, and advanced analysis
- Operationalize insights through instruction,scheduling and memory
- Build a persistent analytical context across projects
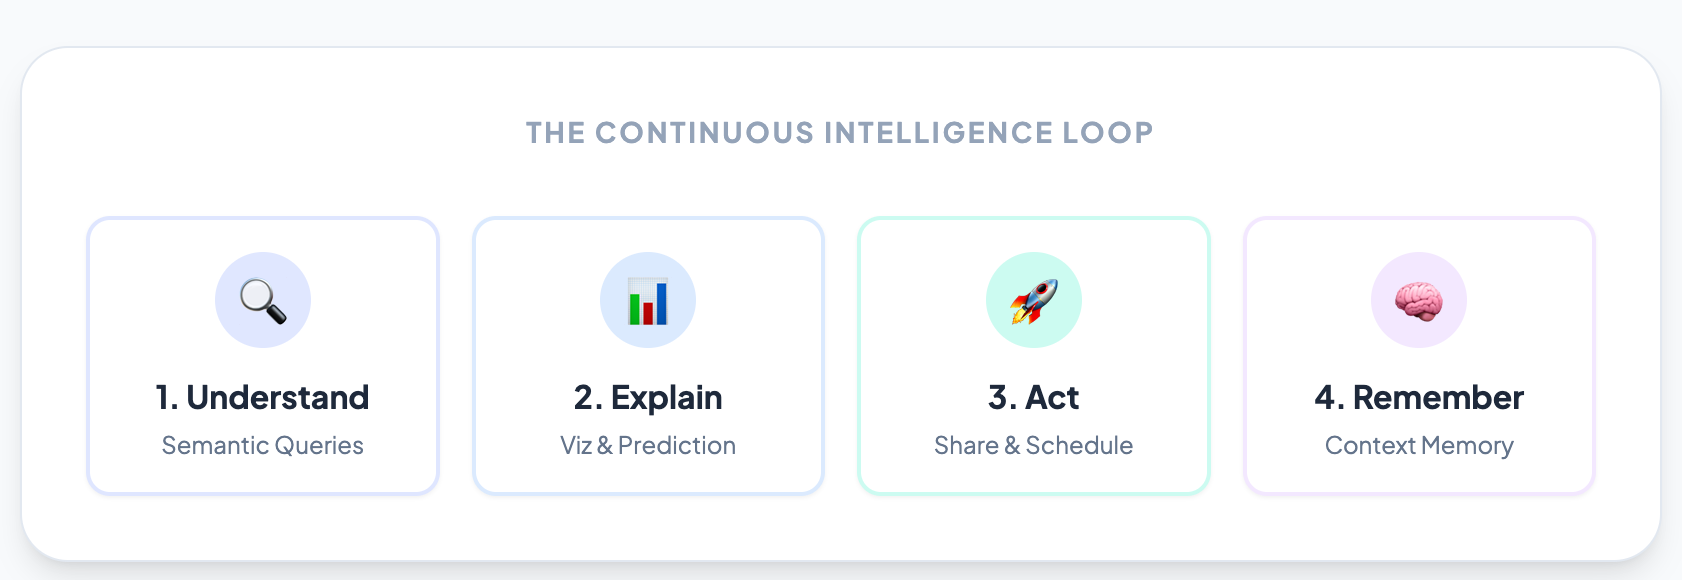
It connects four layers—understanding simple queries, visualizing data, acting on insights, and remembering project context—into a continuous loop. This cycle enables insights to evolve from one-time analyses into repeatable decision systems, creating lasting business impact.
Example 1: E-commerce — Optimizing Ad Spend & Conversion
Business Question
"Why did revenue drop last week, and what should we adjust next? "
Step 1: Ask & Explore
- User asks: “What caused last week’s GMV decline?”
- ChartGen AI performs:
- Metric comparison
- Dimension breakdown (channel, campaign, product)
- Attribution analysis to identify key contributors
- Output:
- Contribution ranking by channel and campaign
- Visual charts highlighting negative drivers
Step 2: Explain & Predict
- ChartGen AI generates:
- Attribution report explaining why GMV dropped
- Short-term revenue prediction under different budget scenarios
- Output:
- Insight report with recommended budget adjustments
- Predictive projection chart
Step 3: Act & Operationalize
- Report is:
- Exported as PDF / dashboard
- Shared with marketing & finance teams
- A scheduled task is created:
- Weekly GMV attribution summary pushed every Monday
Step 4: Remember & Improve
- Project memory stores:
- Key metrics definition (GMV, CAC)
- Preferred dimensions (channel, campaign)
- Instruction: “Always prioritize paid traffic analysis”
- Business Impact
- Faster diagnosis of revenue changes
- Reduced trial-and-error in budget allocation
- A repeatable weekly decision workflow instead of ad-hoc analysis
Example 2: Finance — Monitoring Risk & Performance
Business Question Are we seeing early signs of risk exposure this quarter?
Step 1: Ask & Monitor
- User queries:
- Portfolio performance trends
- Exposure by asset type or region
- ChartGen AI visualizes time-series and distribution changes
Step 2: Advanced Analysis
- ChartGen AI runs:
- Contribution analysis to identify risk drivers
- Forecasting to project future exposure
- Output:
- Risk contribution breakdown
- Forward-looking risk trend
Step 3: Automate Insight Delivery
- Scheduled alert:
- Pushes weekly risk summaries
- Notifies stakeholders when thresholds are exceeded
Step 4: Context Memory
- ChartGen AI remembers:
- Risk thresholds ○Preferred reporting cadence
- Stakeholder-specific views
- Business Impact
- Early risk detection
- Fewer manual checks
- Consistent, explainable reporting for decision-makers
From Insight to Habit
ChartGen AI helps teams move:
- From questions → answers
- From answers → actions
- From actions → habits
By combining analysis, delivery, scheduling, and memory, ChartGen AI transforms analytics from a reactive task into a continuous business capability.
ChartGen AI doesn’t just analyze data. It helps organizations remember, repeat, and scale good decisions.