Drowning in a sea of data? We turn complexity into clarity.
Data should do more than sit in tables. It should speak, inspire, and spark ideas.
Interpretation
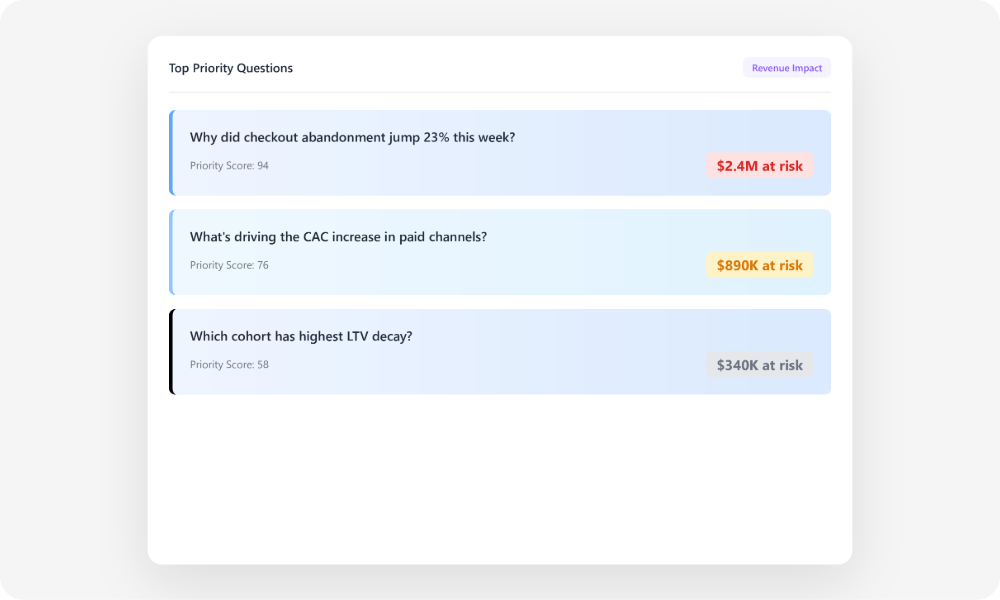
Know what matters now: Finds the three most critical questions for your objectives, ordered by impact and certainty—next actions included.
Visualization
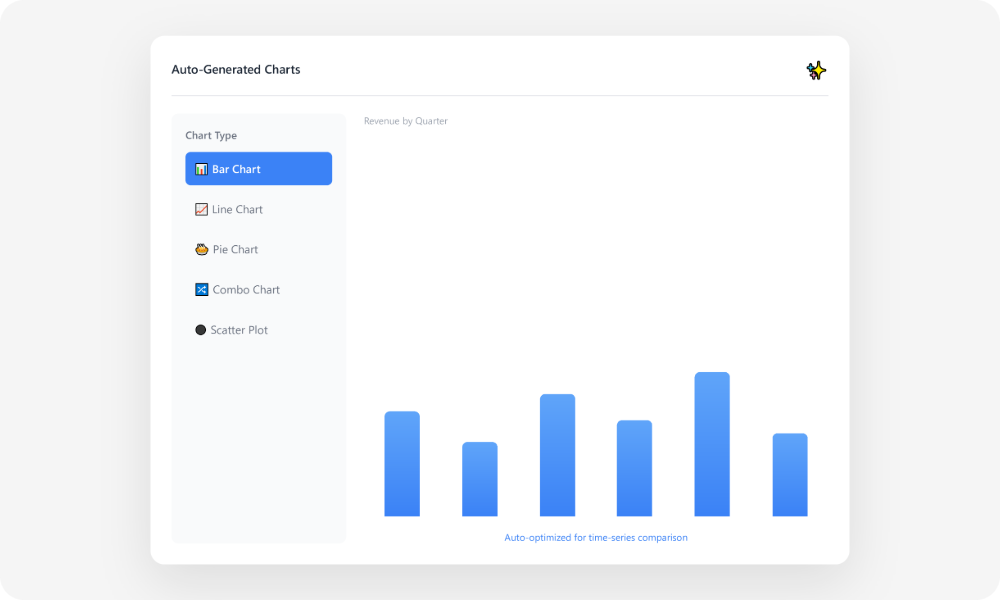
Auto-selects the right chart, ready to share: Picks trend, comparison, distribution, correlation, cohort, or funnel based on your data. Axes, units, and labels are set automatically—export in one click.
Anomalies
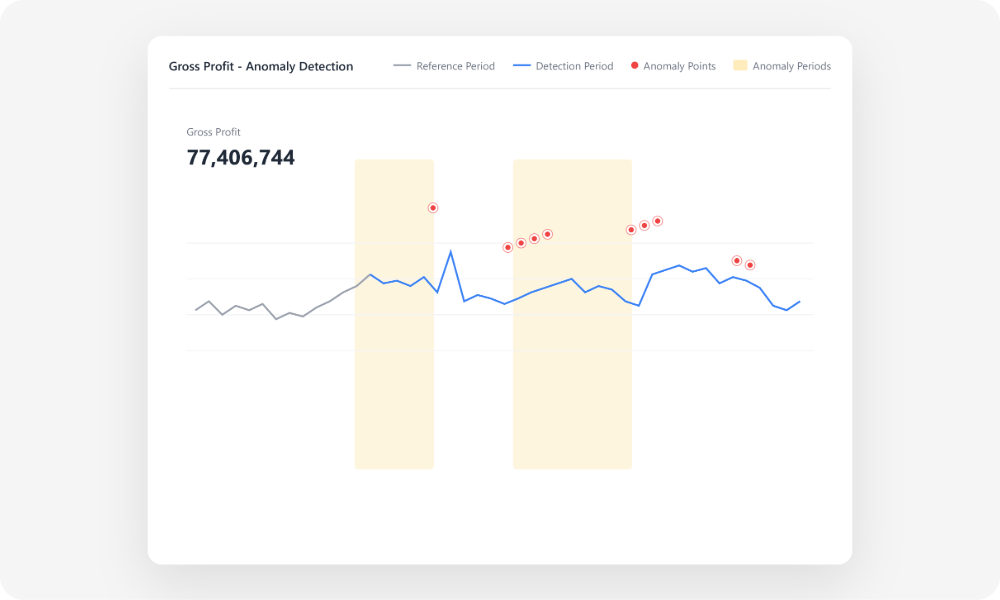
Monitors metrics and explains spikes: Tracks baselines with seasonality and holidays. When a metric deviates, you get an alert with impact size, affected segments, and likely drivers.
Attribution
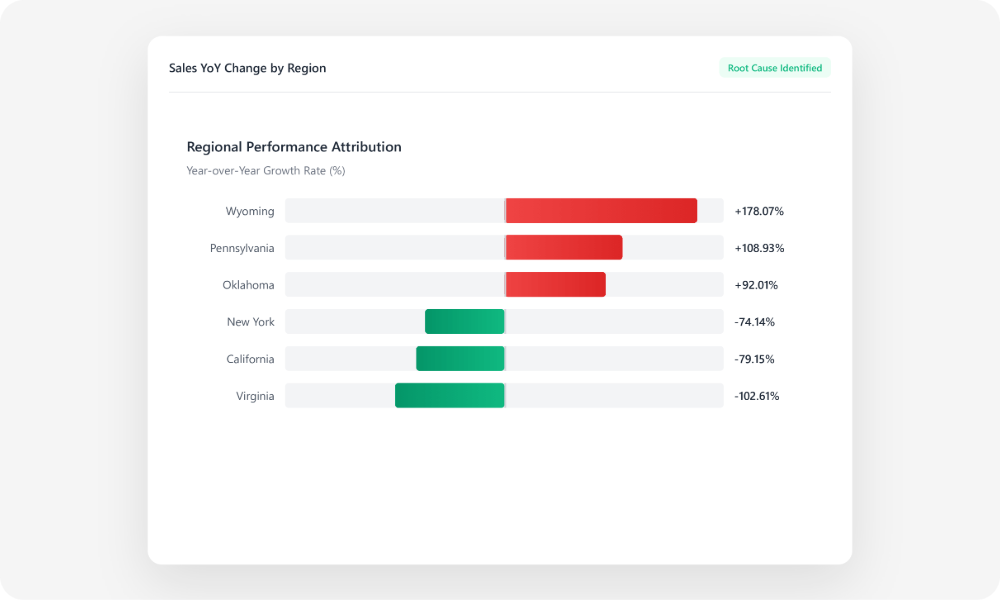
From what changed to what to change: Links movements to channels, audiences, regions, or SKUs. Surfaces top drivers, recommended actions, and expected impact with traceable assumptions.
Prediction
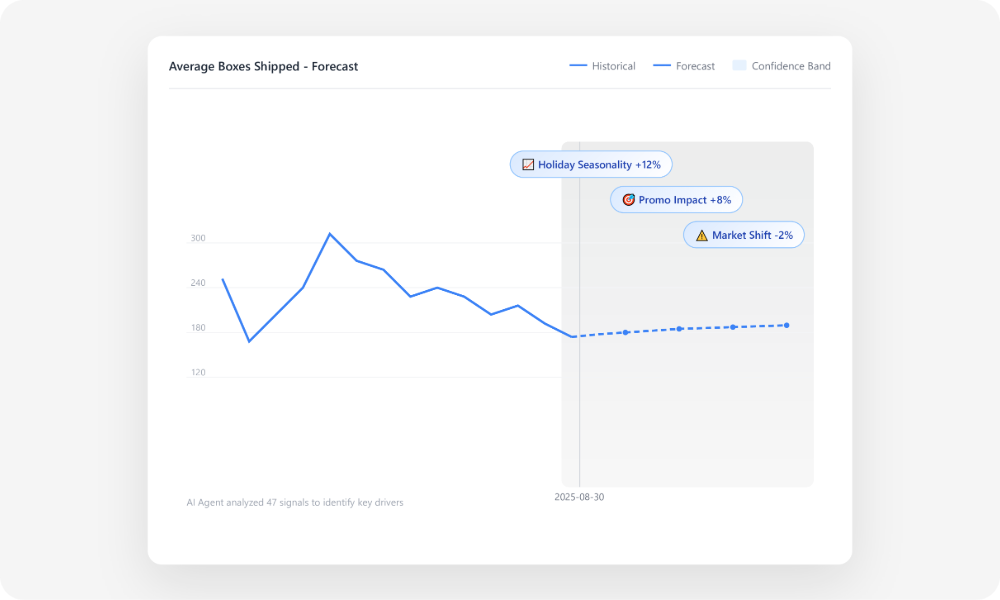
Forecasts with reasons you can test: Produces interval forecasts with key drivers. Run what-if scenarios and see projected effects and model error.
FAQ
Find answers about Ada.im, your AI Data Analyst
What is Ada.im?
What makes Ada.im different from other data analysis tools?
What data sources does Ada.im support?
What kind of reports can Ada.im generate?
Do I need coding or SQL skills to use Ada.im?
Does Ada.im hallucinate or provide inaccurate data?
Who should use Ada.im?
How fast can Ada.im generate reports?
What are the four levels of data agents in Ada.im?
An early-stage AI lab on a mission to build the most powerful AI tools for knowledge workers.